Exam questions · Maths · Statistics
Histograms and Sampling
- 6 exam questions
- 17 marks
- 9 quick checks
-
1 Work out [3 marks]
The table shows the times of some people. For the class \(0 < x \leq 4\) the frequency is 8, for \(4 < x \leq 10\) it is 30, and for \(10 < x \leq 20\) it is 40. Work out the frequency density for each class.
Show answerHide answer
Model answer
The widths are 4, 6 and 10. The frequency densities are \(\dfrac{8}{4} = 2\), \(\dfrac{30}{6} = 5\) and \(\dfrac{40}{10} = 4\).
Mark scheme
- Class widths 4, 6 and 10 used — M1
- At least two frequency densities correct — A1
- 2, 5 and 4 — A1
-
2 Work out [4 marks]
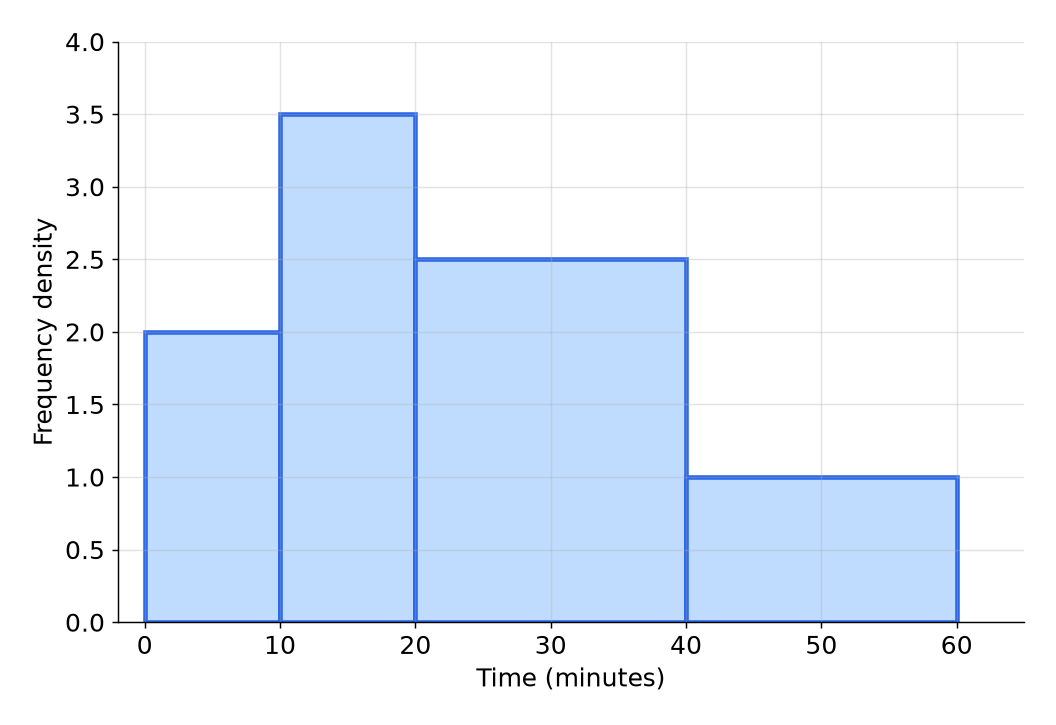
The histogram shows the times, in minutes, that some people took to complete a puzzle. (a) Work out the number of people who took more than 20 minutes and up to 40 minutes. (2 marks) (b) Work out the number of people who took more than 40 minutes. (2 marks)
Show answerHide answer
Model answer
(a) The frequency is the area of the bar: \(2.5 \times 20 = 50\). (b) The bar from 40 to 60 has a frequency density of 1 and a width of 20, so \(1 \times 20 = 20\).
Mark scheme
- (a) \(2.5 \times 20\) — M1
- (a) 50 — A1
- (b) \(1 \times 20\) — M1
- (b) 20 — A1
-
3 Work out [2 marks]
On a histogram the bar for the class \(10 < x \leq 30\) has a frequency density of 3. Work out an estimate for the number of values in the class \(10 < x \leq 25\).
Show answerHide answer
Model answer
The width of \(10 < x \leq 25\) is 15, so the estimate is \(3 \times 15 = 45\).
Mark scheme
- \(3 \times 15\) — M1
- 45 — A1
-
4 Work out [3 marks]
A school has 200 pupils in Year 9, 240 pupils in Year 10 and 160 pupils in Year 11. Hira takes a stratified sample of 60 pupils. Work out the number of pupils from each year group in her sample.
Show answerHide answer
Model answer
The school has \(200 + 240 + 160 = 600\) pupils. Year 9: \(\dfrac{200}{600} \times 60 = 20\). Year 10: \(\dfrac{240}{600} \times 60 = 24\). Year 11: \(\dfrac{160}{600} \times 60 = 16\).
Mark scheme
- \(\dfrac{200}{600} \times 60\) or the total 600 seen — M1
- At least two numbers correct — A1
- 20, 24 and 16 — A1
-
5 Work out [3 marks]
A scientist catches 50 fish in a lake, marks them and puts them back. Later she catches 80 fish, and 10 of them are marked. (a) Work out an estimate for the number of fish in the lake. (2 marks) (b) State one assumption you have made. (1 mark)
Show answerHide answer
Model answer
(a) \(\dfrac{10}{80} = \dfrac{50}{N}\), so \(N = \dfrac{50 \times 80}{10} = 400\). (b) The marked fish have mixed evenly with the others, and the number of fish in the lake has not changed.
Mark scheme
- (a) \(\dfrac{50 \times 80}{10}\) — M1
- (a) 400 — A1
- (b) The marked fish have mixed evenly, or the population has not changed — B1
-
6 Explain [2 marks]
Ravi wants to find the favourite sport of the students in his school. He asks the first 20 students who leave the sports hall. (a) Give a reason why his sample may be biased. (1 mark) (b) Describe a better way to choose a sample. (1 mark)
Show answerHide answer
Model answer
(a) The students leaving the sports hall are more likely to like sport. (b) Number all the students and use random numbers to choose the sample.
Mark scheme
- (a) A reason relating to the students being more likely to like sport — B1
- (b) A random sample from all the students — B1
Quick check
-
1
What is the formula for frequency density?
Show answerHide answer
B: Frequency divided by class width
Frequency density \(= \dfrac{\text{frequency}}{\text{class width}}\).
-
2
What does the area of a bar in a histogram show?
Show answerHide answer
A: The frequency
Area \(=\) frequency density \(\times\) class width \(=\) frequency.
-
3
A histogram bar has class width 20 and frequency density 3. What is the frequency?
Show answerHide answer
D: \(60\)
\(3 \times 20 = 60\).
-
4
A class of width 10 has frequency 30. What is its frequency density?
Show answerHide answer
C: \(3\)
\(\dfrac{30}{10} = 3\).
-
5
A survey about exercise only asks people leaving a gym. What is wrong with the sample?
Show answerHide answer
B: It is biased towards people who exercise
People at a gym are not typical of the whole population.
-
6
A school has 600 pupils, 240 in Year 10. A stratified sample of 50 is taken. How many Year 10 pupils are in the sample?
Show answerHide answer
A: \(20\)
\(\dfrac{240}{600} \times 50 = 20\).
-
7
50 fish are marked and released. A second sample of 40 fish contains 8 marked fish. What is the estimate of the population?
Show answerHide answer
D: \(250\)
\(\dfrac{50 \times 40}{8} = 250\).
-
8
A histogram bar from 30 to 40 has frequency 40. Estimate the number of values from 30 to 35.
Show answerHide answer
C: \(20\)
35 is halfway through the class, so about half the frequency: 20.
-
9
Why does a larger sample usually give a better estimate?
Show answerHide answer
B: It is more likely to represent the whole population
Bigger samples are less affected by chance.