Slides · PPTX · 374 KB · 22 slides
Working with suppliers.pptx
Built from the lesson script on 28 September 2026.
EDEXCEL GCSE BUSINESS · PAPER 2

Working with suppliers
Making operational decisions
Lesson 2 of 4
openrevise.com
EDEXCEL GCSE BUSINESS · PAPER 2

Last Lesson
Making operational decisions
Lesson 2 of 4
Answer from memory before the answers appear.
1
Name the three production processes.
2
Which process has the lowest cost per unit?
3
What is productivity?
4
Give one impact of technology on production.
openrevise.com
EDEXCEL GCSE BUSINESS · PAPER 2

Last Lesson - Answers
Making operational decisions
Lesson 2 of 4
1
Name the three production processes.
Job, batch and flow.
2
Which process has the lowest cost per unit?
Flow production.
3
What is productivity?
Output per worker in a period of time.
4
Give one impact of technology on production.
Lower unit costs, higher productivity, better quality or more flexibility.
openrevise.com
EDEXCEL GCSE BUSINESS · PAPER 2

Learning Objectives
Making operational decisions
Lesson 2 of 4
1
Interpret a bar gate stock graph.
2
Explain just-in-time (JIT) stock control.
3
Explain the factors in choosing a supplier: quality, delivery, availability, cost and trust.
4
Explain the effect of logistics and supply decisions on costs, reputation and customer satisfaction.
openrevise.com
EDEXCEL GCSE BUSINESS · PAPER 2

Why Manage Stock?
Making operational decisions
Lesson 2 of 4
Stock is the raw materials, components and finished goods a business holds.
Too much stock
Ties up cash, costs money to store and insure, and may go out of date, be damaged or stolen.
Too little stock
Production stops and customers are let down, so sales and reputation suffer.
The balance
Enough stock to keep running and meet demand, without wasting money holding too much.
openrevise.com
EDEXCEL GCSE BUSINESS · PAPER 2

PART ONE
Bar Gate Stock Graphs
A picture of stock rising and falling.
openrevise.com
EDEXCEL GCSE BUSINESS · PAPER 2

Reading a Bar Gate Stock Graph
Making operational decisions
Lesson 2 of 4
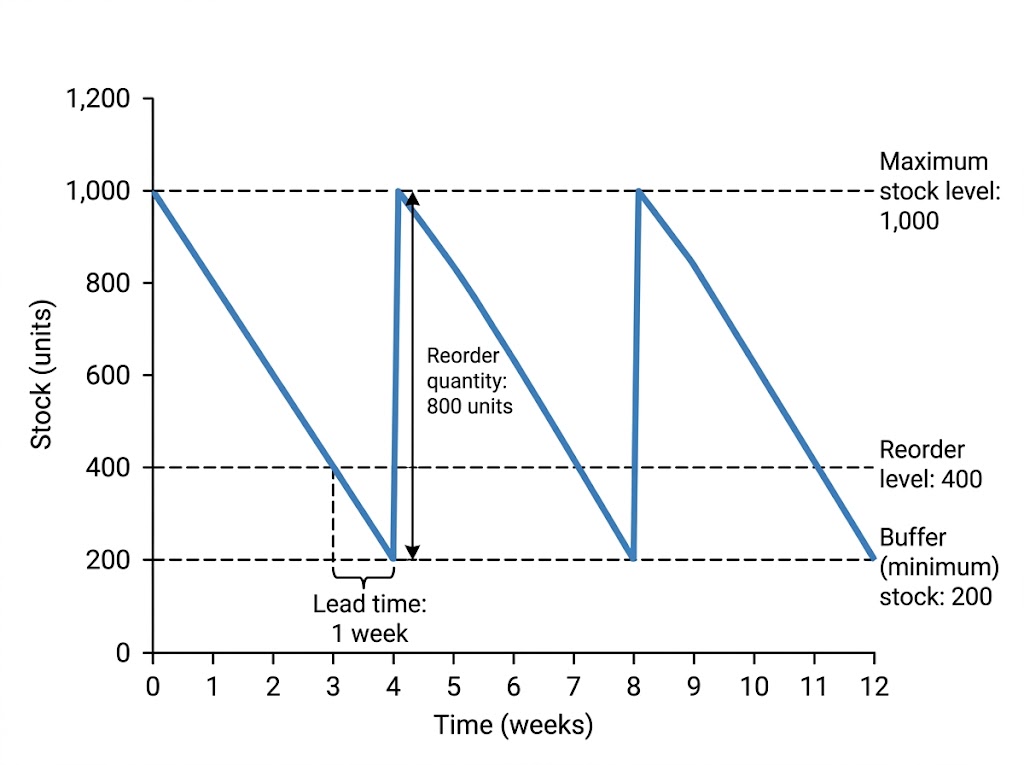
Stock falls as it is used, is reordered at 400 units, and is topped back up to 1,000 when the delivery arrives.
A bar gate stock graph shows stock falling as it is used, then jumping back up when a delivery arrives. Here the business uses 200 units a week. When stock falls to 400 it reorders; one week later 800 units arrive, just as stock reaches the 200-unit buffer.
openrevise.com
EDEXCEL GCSE BUSINESS · PAPER 2

The Parts of a Bar Gate Stock Graph
Making operational decisions
Lesson 2 of 4
Term
Meaning
On the graph
Maximum stock level
The most stock the business wants to hold
1,000 units
Reorder level
The stock level at which a new order is placed
400 units
Buffer (minimum) stock
The lowest level stock should fall to, kept for emergencies
200 units
Reorder quantity
The amount ordered each time
800 units
Lead time
The time between placing an order and it arriving
1 week
openrevise.com
EDEXCEL GCSE BUSINESS · PAPER 2

Using the Graph
Making operational decisions
Lesson 2 of 4
Work out what is used during the lead time.
The business uses 200 units a week and reorders when stock falls to 400 units. The lead time is 1 week. How much stock will be left when the delivery arrives, and what will stock be after the 800-unit delivery?
1
Stock used during the lead time
200 units a week × 1 week = 200 units
2
Stock left when the delivery arrives
400 - 200 = 200 units (the buffer stock)
3
Stock after the delivery
200 + 800 = 1,000 units (the maximum)
ANSWER
200 units left; 1,000 units after the delivery.
openrevise.com
EDEXCEL GCSE BUSINESS · PAPER 2

PART TWO
Just-in-Time
Holding almost no stock at all.
openrevise.com
EDEXCEL GCSE BUSINESS · PAPER 2

Just-in-Time (JIT) Stock Control
Making operational decisions
Lesson 2 of 4
ADVANTAGES
• Very little money tied up in stock.
• Low storage, insurance and waste costs.
• Less space needed, so smaller premises.
• Stock is always fresh and up to date.
DISADVANTAGES
• Production stops if a delivery is late.
• Relies on very reliable suppliers.
• Frequent small deliveries can cost more.
• Cannot meet a sudden rise in demand.
• Loses bulk-buying discounts.
openrevise.com
EDEXCEL GCSE BUSINESS · PAPER 2

How JIT Works
Making operational decisions
Lesson 2 of 4
Just-in-time means ordering materials to arrive exactly when they are needed, and holding little or no stock.
Frequent deliveries
Suppliers deliver small amounts often, sometimes several times a day.
Close relationships
The business and its suppliers share production plans so deliveries arrive on time.
Suits
Businesses with reliable suppliers nearby and predictable demand, such as car makers and supermarkets.
openrevise.com
EDEXCEL GCSE BUSINESS · PAPER 2

PART THREE
Choosing Suppliers
Procurement: finding and buying from the right suppliers.
openrevise.com
EDEXCEL GCSE BUSINESS · PAPER 2

Factors in Choosing a Supplier
Making operational decisions
Lesson 2 of 4
Quality
Materials must be good enough to make a quality product; poor materials mean faults and complaints.
Delivery
The cost, speed and reliability of delivery - late deliveries stop production.
Availability
The supplier must be able to supply the quantities needed, when they are needed.
Cost
A lower price reduces the business's costs, but the cheapest is not always the best.
Trust
A reliable supplier with a good track record, who communicates honestly when problems arise.
openrevise.com
EDEXCEL GCSE BUSINESS · PAPER 2

Stock on the Shelves
Making operational decisions
Lesson 2 of 4

Barcode scanning keeps an exact, up-to-date record of stock.
Modern businesses track every item of stock with barcodes and software. The system can warn managers - or even order automatically - when stock reaches the reorder level.
openrevise.com
EDEXCEL GCSE BUSINESS · PAPER 2

The Effect of Supply Decisions
Making operational decisions
Lesson 2 of 4
Logistics is the management of getting materials in and products out on time. Supply decisions affect the whole business.
Costs
Cheaper suppliers and efficient deliveries reduce costs; unreliable ones cause expensive delays.
Reputation
Poor-quality materials or unethical suppliers can damage the business's reputation.
Customer satisfaction
Products in stock, of good quality and delivered on time keep customers happy and loyal.
openrevise.com
EDEXCEL GCSE BUSINESS · PAPER 2
Making operational decisions
Lesson 2 of 4
CASE STUDY

Toyota and the Chip Shortage
Toyota developed just-in-time production in Japan, and car makers around the world copied it. JIT kept their stock costs extremely low. But in 2021 a worldwide shortage of computer chips showed the risk. Modern cars need hundreds of chips, and car makers holding little stock could not get enough. Factories around the world, including in the UK, had to cut or stop production, and customers waited months for new cars. Many businesses began holding more buffer stock of key parts.
JIT
Developed by Toyota in Japan
2021
A global chip shortage stops car production
openrevise.com
EDEXCEL GCSE BUSINESS · PAPER 2

Key Terms
Making operational decisions
Lesson 2 of 4
Stock
Raw materials, components and finished goods held by a business.
Bar gate stock graph
A graph showing how stock levels rise and fall over time.
Reorder level
The stock level at which a new order is placed.
Buffer stock
The minimum stock kept for emergencies.
Lead time
The time between ordering stock and it arriving.
Just-in-time (JIT)
Ordering stock to arrive exactly when it is needed, holding little or none.
openrevise.com
EDEXCEL GCSE BUSINESS · PAPER 2

Key Terms (cont.)
Making operational decisions
Lesson 2 of 4
Procurement
Finding and buying the materials and services a business needs.
Logistics
Managing the movement of materials and products into and out of a business.
openrevise.com
EDEXCEL GCSE BUSINESS · PAPER 2
Making operational decisions
Lesson 2 of 4

YOUR TASK
Stock Detective
12 minutes
A café uses 50 bags of coffee beans a week. Its maximum stock is 300 bags, its reorder level is 150 bags, its buffer stock is 50 bags and the lead time is 2 weeks. Sketch the bar gate stock graph for 12 weeks. Then explain one risk if the supplier's lead time increased to 3 weeks.
1
Draw the graph with the levels labelled.
2
Mark the reorder point and delivery each time.
3
Explain the risk of a longer lead time.
WHAT A GOOD ANSWER SHOWS
A correct saw-tooth graph with all levels labelled, and the risk that the café runs out - stock would fall to 0 before delivery.
openrevise.com
EDEXCEL GCSE BUSINESS · PAPER 2

Can I...?
Making operational decisions
Lesson 2 of 4
Explain why businesses manage stock.
Read and label a bar gate stock graph.
Calculate stock levels from a graph.
Explain just-in-time.
Give advantages and disadvantages of JIT.
Explain the five factors in choosing a supplier.
Explain how supply decisions affect costs, reputation and customer satisfaction.
openrevise.com
EDEXCEL GCSE BUSINESS · PAPER 2
Summary & Exam Focus
A bar gate stock graph shows maximum stock, reorder level, buffer stock, reorder quantity and lead time.
JIT holds little stock, cutting costs, but relies on reliable suppliers.
Suppliers are chosen on quality, delivery, availability, cost and trust.
Supply decisions affect costs, reputation and customer satisfaction.
EXAM FOCUS
Explain one disadvantage to a business of using just-in-time stock control. (3 marks)
For bar gate graphs, read the numbers carefully off the axes and show your working. For JIT, link any answer to the reliability of suppliers.
openrevise.com
← → to move, F to present full screen, G for every slide at once.