Maths · Functions, Sequences and Rates of Change
Viewing as
Teaching this? The teacher view opens every answer and mark scheme.
Rates of Change and Areas Under Graphs
Finding gradients of curves with tangents, average rates of change, and estimating areas under graphs with trapezia.
Learning Objectives
- 1Find the gradient of a curve at a point by drawing and using a tangent.
- 2Find the average rate of change between two points, using a chord.
- 3Interpret gradients as rates, such as speed and acceleration, with their units.
- 4Estimate the area under a graph using trapezia, and say whether it is an over- or underestimate.
Rates of change
The gradient of a straight line is constant, but the gradient of a curve changes from point to point. To find the gradient at one point, you draw a tangent, a straight line that just touches the curve at that point, and find its gradient. The gradient of a graph is a rate of change. On a distance-time graph it is the speed, and on a velocity-time graph it is the acceleration. The area under a graph is also useful, and can be estimated by splitting it into trapezia. All of these skills are Higher tier on every board.
The gradient of a curve
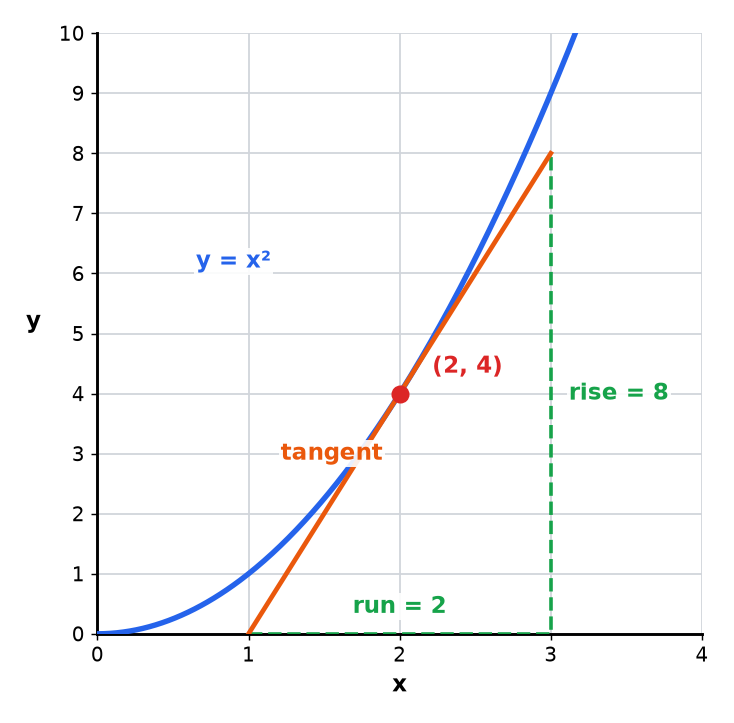
The tangent at \((2, 4)\) passes through \((1, 0)\) and \((3, 8)\). Its gradient is the rise divided by the run, \(\dfrac{8}{2} = 4\), so the gradient of the curve at \(x = 2\) is 4.
Finding a gradient from a tangent
- Draw A straight line that touches the curve at the point and does not cross it there.
- Pick two points Choose two points that are far apart on the tangent, so that the answer is accurate.
- Triangle Draw a right-angled triangle and read the rise and the run.
- Gradient \(\dfrac{\text{rise}}{\text{run}} = \dfrac{8}{2} = 4\).
Gradient at a point
The tangent to a curve at \((4, 16)\) passes through \((2, 0)\) and \((6, 32)\). Work out the gradient of the curve at \(x = 4\), and say what it means if the graph is distance (metres) against time (seconds).
Show the solutionHide the solution
- 1 Rise \(32 - 0 = 32\).
- 2 Run \(6 - 2 = 4\).
- 3 Gradient \(\dfrac{32}{4} = 8\).
- 4 Meaning The gradient of a distance-time graph is the speed, so the speed at 4 s is 8 m/s.
AnswerThe gradient is 8, so the speed is 8 m/s
Average rate of change
The average rate of change between two points is the gradient of the chord, the straight line that joins them.
-
Chord
A straight line joining two points on the curve.
-
Formula
\(\dfrac{\text{change in } y}{\text{change in } x}\).
-
Example
For \(y = x^2\) between \(x = 1\) and \(x = 4\): \(\dfrac{16 - 1}{4 - 1} = 5\).
-
Units
The units are the \(y\) unit per \(x\) unit, such as metres per second.
The area under a graph
On a velocity-time graph the area under the curve is the distance travelled.
-
Strips
Split the area into strips of equal width.
-
Trapezium
Each strip is a trapezium: \(\dfrac{1}{2}(a + b)h\), where \(a\) and \(b\) are the two parallel sides and \(h\) is the width.
-
Add
Add the areas of all the trapezia for an estimate.
-
Units
The units of the area are the units of \(y\) times the units of \(x\), so metres per second times seconds is metres.
Trapezia under a curve
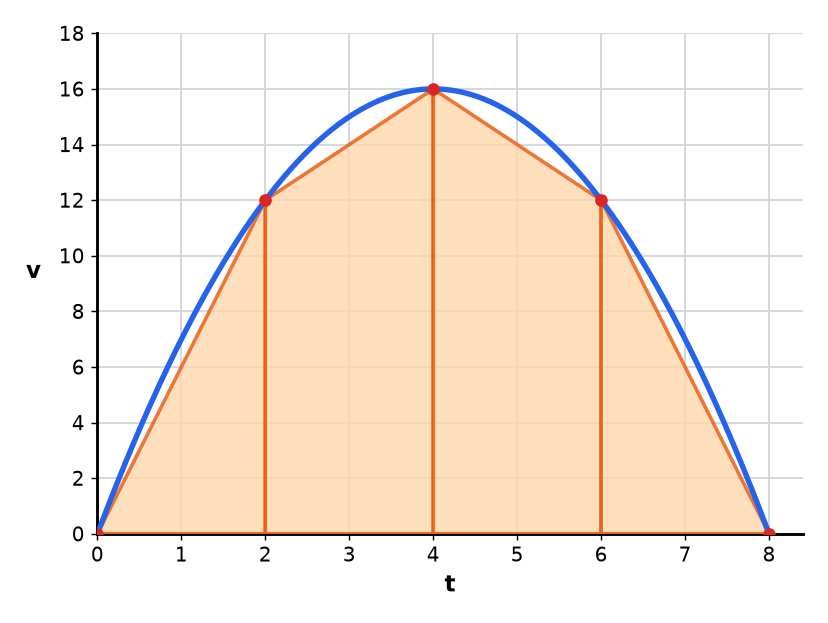
The heights at \(t = 0, 2, 4, 6, 8\) are \(0, 12, 16, 12, 0\). Each strip has width 2, so the estimate of the area is \(\dfrac{1}{2} \times 2 \times (0 + 12) + \dfrac{1}{2} \times 2 \times (12 + 16) + \dfrac{1}{2} \times 2 \times (16 + 12) + \dfrac{1}{2} \times 2 \times (12 + 0) = 80\).
Reading the estimate
- Strip 1 \(\dfrac{1}{2} \times 2 \times (0 + 12) = 12\).
- Strip 2 \(\dfrac{1}{2} \times 2 \times (12 + 16) = 28\).
- Strips 3 and 4 28 and 12.
- Total \(12 + 28 + 28 + 12 = 80\) metres.
Over or under?
Explain whether the estimate of 80 metres is an overestimate or an underestimate of the distance travelled.
Show the solutionHide the solution
- 1 Look at the shape The curve bends downwards, so each straight top lies below the curve.
- 2 Compare areas The trapezia are inside the area under the curve.
- 3 Conclusion The estimate is smaller than the true value, so it is an underestimate.
- 4 Opposite case For a curve that bends upwards, the straight tops lie above the curve, and the estimate is an overestimate.
AnswerIt is an underestimate, because the curve is above the tops of the trapezia
Test yourself
-
1
How do you find the gradient of a curve at a point?
Show answerHide answer
Draw a tangent and work out its gradient.
-
2
What is a chord?
Show answerHide answer
A straight line joining two points on a curve.
-
3
What is the gradient of a distance-time graph?
Show answerHide answer
The speed.
-
4
What is the area under a velocity-time graph?
Show answerHide answer
The distance travelled.
-
5
What is the area of a trapezium?
Show answerHide answer
\(\dfrac{1}{2}(a + b)h\).
Exam technique: gradients and areas
The marks are for the method, so show the numbers.
-
Tangent
Draw it carefully with a ruler, so that it touches the curve and does not cross it.
-
Show the points
Write down the coordinates you used to find the gradient.
-
Units
Give units, such as m/s or m/s\(^2\).
-
Over or under
Look at which way the curve bends, and explain with the straight edges of the trapezia.
Summary and exam focus
- The gradient of a curve at a point is the gradient of the tangent.
- The average rate of change is the gradient of the chord.
- Gradient of a distance-time graph is speed, and of a velocity-time graph is acceleration.
- Estimate the area under a curve with trapezia, and explain any over- or underestimate.
Exam focus
The tangent to a distance-time graph at \(t = 4\) passes through \((2, 0)\) and \((6, 32)\). Work out the speed at \(t = 4\). (2 marks) (2 marks)
Gradient \(= \dfrac{32 - 0}{6 - 2} = \dfrac{32}{4} = 8\), so the speed is 8 m/s. Write the units.
Key terms
The words this lesson expects you to use. Each one is linked from the first place it appears above.
- Tangent
- A straight line that touches a curve at one point.
- Chord
- A straight line joining two points on a curve.
- Gradient
- A measure of the steepness of a line.
- Rate of change
- How quickly one quantity changes compared with another.
- Average rate of change
- The gradient of the chord between two points.
- Trapezium
- A quadrilateral with one pair of parallel sides.
- Estimate
- An approximate answer.
- Overestimate
- An estimate that is larger than the true value.
- Underestimate
- An estimate that is smaller than the true value.
You've finished the notes
Check your understanding
Test yourself while it is fresh. Start with the flashcards, then try the exam questions.
Something here looks wrong?
Tell us what and we will go and look. It goes to whoever writes these pages, nobody else, and we do not ask who you are — so there is nothing to sign and nothing comes back to you.