Viewing as
Teaching this? The teacher view adds 2 files, the mark schemes and the model answers.
Maths · Graphs
Graphing rates of change
The gradient of a graph is a rate of change. On a distance-time graph it is the speed; at Higher, on a velocity-time graph it is the acceleration, and the area underneath is the distance.
Last Lesson and Before
Answer each one, then check.
-
1
Last lesson: what is the gradient between \((0, 0)\) and \((2, 60)\)?
Show answerHide answer
30
-
2
A car travels 120 km in 2 hours. What is its average speed?
Show answerHide answer
60 km/h
-
3
How many minutes are in 0.75 hours?
Show answerHide answer
45 minutes
-
4
Area of a triangle with base 4 and height 12?
Show answerHide answer
24
Learning Objectives
- 1Read and draw distance-time graphs.
- 2Work out speed from the gradient of a distance-time graph.
- 3Work out average speed for a whole journey.
- 4(Higher) Use the gradient of a velocity-time graph for acceleration, and the area under it for distance.
Reading a Distance-Time Graph
On a distance-time graph the gradient is the speed. The first section rises 30 km in 1 hour: 30 km/h. The flat section is a 30-minute stop. The return covers 30 km in 45 minutes: \(30 \div 0.75 = 40\) km/h.
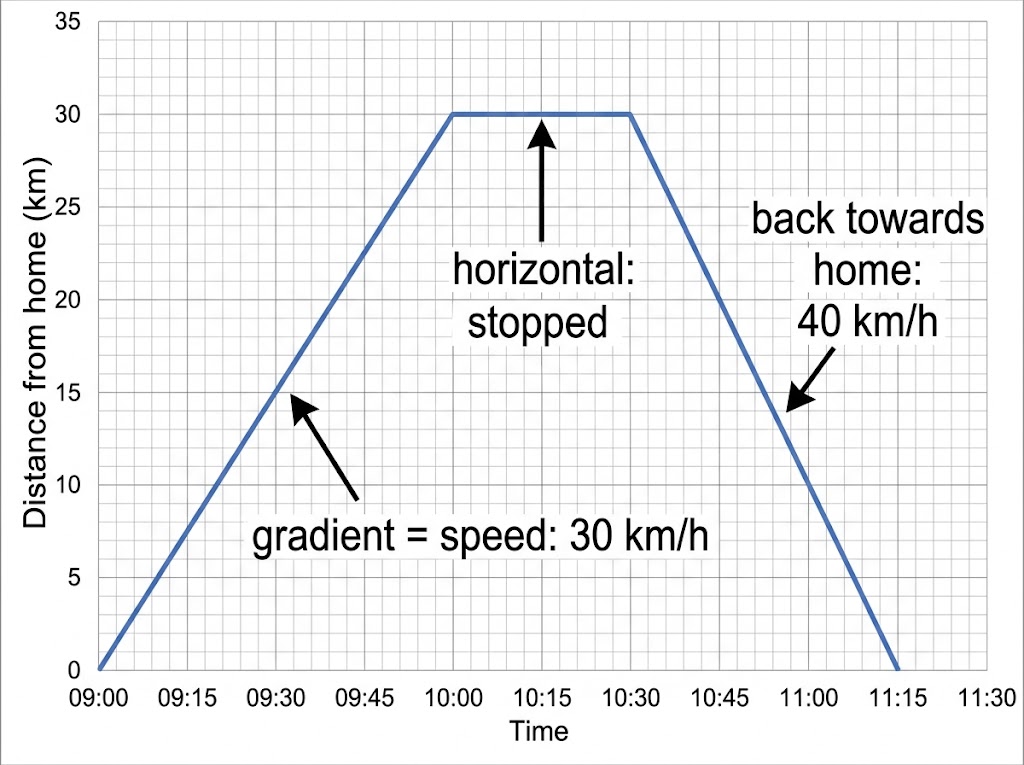
Steeper means faster; flat means stopped; going down means coming back.
Distance-Time Graphs
Distance goes up the side, time along the bottom.
-
Gradient is speed
Speed \(= \dfrac{\text{distance}}{\text{time}}\) - the change up over the change across.
-
Horizontal line
Not moving: the distance from the start is not changing.
-
Steeper
Faster.
-
Minutes to hours
For km/h, change minutes to hours first: 45 minutes \(= 0.75\) hours.
Speed from the Graph
On the journey in the diagram, work out (a) the speed on the way home, and (b) the average speed for the whole journey, including the stop.
Show the solutionHide the solution
- 1 (a) Distance and time on the way home 30 km in 45 minutes = 0.75 hours
- 2 Speed \(30 \div 0.75 = 40\) km/h
- 3 (b) Total distance and total time 60 km in 2 hours 15 minutes = 2.25 hours
- 4 Average speed \(60 \div 2.25 = 26.66\ldots\)
Answer(a) 40 km/h (b) 26.7 km/h
Other Rates of Change
Any graph of a quantity against time has a gradient that is a rate.
-
Water level against time
Gradient = how fast the level rises (cm per minute).
-
Cost against number
Gradient = cost of one more item.
-
Units of the gradient
Units up the side "per" units along the bottom: km per hour, litres per minute.
-
Curved graphs
A curve means the rate is changing: steeper parts change faster.
Velocity-Time Graphs
Now velocity (speed) is up the side.
-
Gradient is acceleration
Acceleration \(= \dfrac{\text{change in velocity}}{\text{time}}\), in m/s².
-
Negative gradient
Deceleration: slowing down.
-
Horizontal line
Constant speed - NOT stopped.
-
Area is distance
The area under the graph is the distance travelled. Split it into triangles, rectangles and trapeziums.
A Car Journey
A car accelerates uniformly from rest to 12 m/s in 4 seconds, travels at 12 m/s for 10 seconds, then slows uniformly to rest in 6 seconds. Work out (a) the acceleration in the first 4 seconds, and (b) the total distance travelled.
Show the solutionHide the solution
- 1 (a) Gradient of the first section \(12 \div 4 = 3\) m/s²
- 2 (b) Area: first triangle \(\frac{1}{2} \times 4 \times 12 = 24\)
- 3 Rectangle \(10 \times 12 = 120\)
- 4 Last triangle \(\frac{1}{2} \times 6 \times 12 = 36\)
- 5 Add \(24 + 120 + 36 = 180\)
Answer(a) 3 m/s² (b) 180 m
Don't Mix Them Up
Distance-time
- Gradient = speed
- Horizontal = stopped
- Going down = coming back
- Area means nothing useful
Velocity-time (Higher)
- Gradient = acceleration
- Horizontal = constant speed
- Going down = slowing down
- Area = distance travelled
Tell the Story
Draw a distance-time graph for this journey: Priya walks 2 km to a friend's house at 4 km/h, stays for 20 minutes, then they both cycle 6 km to the park in 20 minutes. Then write your own journey story for a partner to graph.
1. Work out each time first.
2. Plot the corners of the journey.
3. Join with straight lines.
A good answer shows: Walk: 2 km in 30 minutes. Flat for 20 minutes (to 50 minutes). Cycle: from 2 km to 8 km between 50 and 70 minutes - a steeper line, 18 km/h.
Can I...?
- 1Read a distance-time graph.
- 2Draw a distance-time graph.
- 3Work out speed from a gradient.
- 4Work out an average speed.
- 5(Higher) Work out acceleration from a velocity-time graph.
- 6(Higher) Work out distance from the area under a velocity-time graph.
Summary & Exam Focus
- Distance-time: gradient = speed; flat = stopped.
- Average speed = total distance ÷ total time.
- (Higher) Velocity-time: gradient = acceleration; area = distance.
Exam focus
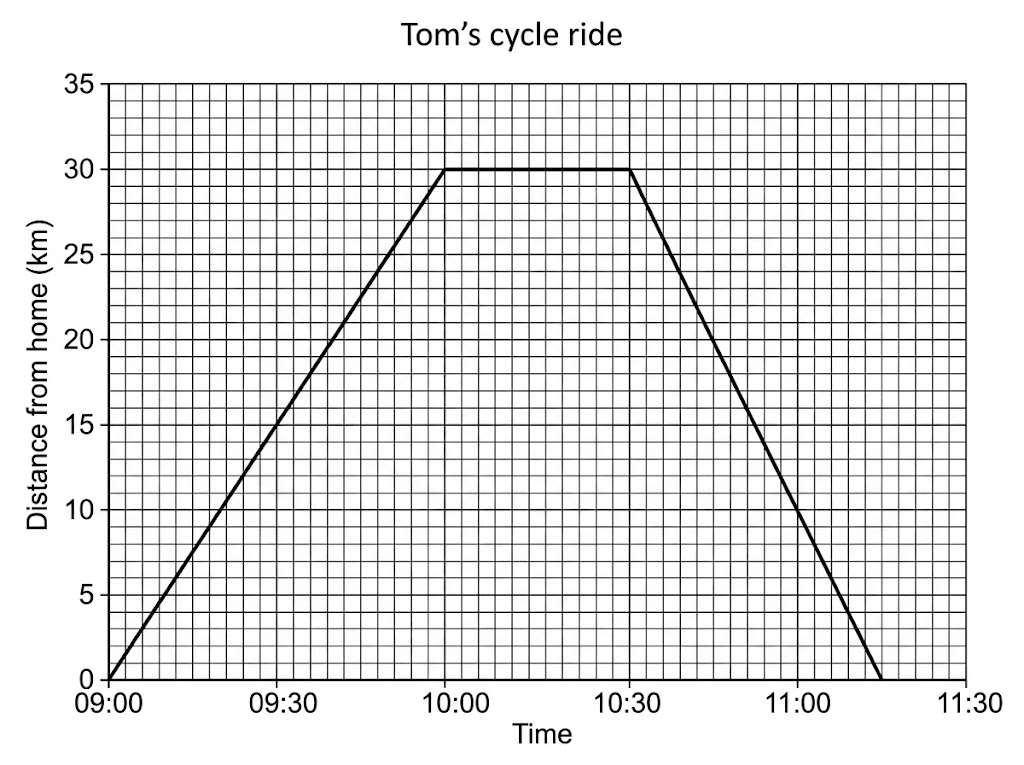
The distance-time graph shows Tom's cycle ride. Work out Tom's speed on his way home, in km/h. (2 marks) (2 marks)
Read the scales carefully - small squares are often 5 or 10 minutes, not 1. Convert minutes to hours before dividing to get km/h.
Key terms
The vocabulary this lesson expects you to use. Each one is linked from the first place it appears above.
- Speed
- Distance travelled per unit of time.
- Average speed
- Total distance divided by total time, including stops.
- Rate of change
- How fast one quantity changes compared with another; the gradient.
- Velocity
- Speed in a given direction.
- Acceleration
- Rate of change of velocity, in m/s².
- Deceleration
- Slowing down; a negative acceleration.
Practice questions
Have a go at each one before you open its answer.
-
Question 1 Non-calculator 4 marks
The distance-time graph shows Tom's cycle ride from his home to a lake and back. (a) At what time did Tom arrive at the lake? (b) How long did Tom stay at the lake? (c) Work out Tom's speed on his way home, in km/h.
Show answerHide answer
Model answer
(a) 10:00 (b) 30 minutes (c) 30 km in 45 minutes: \(30 \div 0.75 = 40\) km/h
Mark scheme
- (a) 10:00 — B1
- (b) 30 minutes — B1
- (c) 30 km and 45 minutes, or \(30 \div 0.75\) — M1
- (c) 40 km/h — A1
-
Question 2 Calculator 2 marks
For the whole of his ride, including the stop, Tom travelled 60 km in 2 hours 15 minutes. Work out his average speed. Give your answer to 1 decimal place.
Show answerHide answer
Model answer
\(60 \div 2.25 = 26.66\ldots = 26.7\) km/h
Mark scheme
- \(60 \div 2.25\) — M1
- 26.7 km/h — A1
-
Question 3 Non-calculator 2 marks
Water is poured into a tank at a constant rate. After 4 minutes the depth is 10 cm. After 10 minutes the depth is 25 cm. Work out the rate at which the depth increases. Give the units of your answer.
Show answerHide answer
Model answer
\(\dfrac{25 - 10}{10 - 4} = \dfrac{15}{6} = 2.5\) cm per minute
Mark scheme
- \(\dfrac{25 - 10}{10 - 4}\) — M1
- 2.5 cm per minute — A1
-
Question 4 Calculator · Higher 4 marks
A car accelerates uniformly from rest to 12 m/s in 4 seconds. It travels at 12 m/s for 10 seconds, then slows down uniformly and stops after another 6 seconds. (a) Work out the acceleration in the first 4 seconds. (b) Work out the total distance the car travels.
Show answerHide answer
Model answer
(a) \(12 \div 4 = 3\) m/s² (b) \(\frac{1}{2} \times 4 \times 12 + 10 \times 12 + \frac{1}{2} \times 6 \times 12 = 24 + 120 + 36 = 180\) m
Mark scheme
- (a) 3 m/s² — B1
- (b) Splitting the area into parts, or using the trapezium rule with parallel sides 20 and 10 — M1
- (b) One correct part: 24, 120 or 36 — M1
- (b) 180 m — A1
Quick check
-
What does a horizontal line on a distance-time graph mean?
Show answerHide answer
D: Stopped
The distance from the start is not changing, so the object is not moving.
-
A distance-time graph rises 12 km in 20 minutes. What is the speed?
Show answerHide answer
B: 36 km/h
20 minutes is \(\frac{1}{3}\) of an hour, so \(12 \times 3 = 36\) km/h.
-
(Higher) What does the area under a velocity-time graph give?
Show answerHide answer
A: Distance travelled
Area = velocity × time = distance.
Downloads
Free to keep, print and annotate.
- Graphing rates of change.pptx Built from the lesson script on 29 September 2026. View
- Graphing rates of change - Completed Notes.docx The full notes for the lesson, to revise from. Built from the lesson script on 29 September 2026. View
- Graphing rates of change - Exam Questions.docx Built from the lesson script on 29 September 2026. View
Something here looks wrong?
Tell us what and we will go and look. It goes to whoever writes these pages, nobody else, and we do not ask who you are — so there is nothing to sign and nothing comes back to you.