Viewing as
Teaching this? The teacher view adds 2 files, the mark schemes and the model answers.
Business · Making financial decisions
Understanding business performance
The average rate of return tells a business whether an investment is worth making. Graphs, financial data, market data and marketing data help it understand its performance - as long as it knows the limits of each.
Last Lesson
Answer from memory before the answers appear.
-
How do you calculate gross profit?
Sales revenue - cost of sales.
-
How do you calculate net profit?
Gross profit - other operating expenses and interest.
-
How do you calculate gross profit margin?
(Gross profit ÷ sales revenue) × 100.
-
What is Bright Bikes' net profit margin?
14% (£70,000 ÷ £500,000 × 100).
Learning Objectives
- 1Calculate and interpret the average rate of return (ARR).
- 2Interpret graphs and charts of business data.
- 3Explain the use of financial, market and marketing data in decision making.
- 4Explain the use and limitations of quantitative and qualitative data.
What Is the Average Rate of Return?
The average rate of return (ARR) shows the average yearly profit from an investment as a percentage of what it cost.
-
Investment
Spending money now to earn more later - a new machine, a new shop or a new delivery van.
-
Formula
ARR (%) = (average annual profit ÷ cost of investment) × 100.
-
Average annual profit
(Total returns - cost of investment) ÷ number of years.
-
What it shows
The higher the ARR, the better the investment. It can be compared with other investments, or with the interest rate a bank would pay.
Calculating ARR
Three steps: total profit, average annual profit, then ARR.
Bright Bikes buys a £40,000 machine to build bike frames. Over 4 years it expects the machine to bring in total returns of £56,000. Calculate the average rate of return.
- 1 Total profit £56,000 - £40,000 = £16,000
- 2 Average annual profit £16,000 ÷ 4 years = £4,000
- 3 ARR (£4,000 ÷ £40,000) × 100 = 10%
AnswerARR = 10%
Using ARR to Make Decisions
ARR helps a business choose between investments.
-
Compare investments
Choose the one with the highest ARR.
-
Compare with interest rates
If the ARR is below what the money would earn in the bank, the investment may not be worth the risk.
-
Set a target
Some businesses only invest if the ARR is above a set level, such as 10%.
-
Limitations
ARR relies on forecast returns, which may be wrong, and ignores when the money comes in and non-financial factors.
Bright Bikes: Four Years of Performance
A chart shows at a glance what a table of numbers hides. Bright Bikes' revenue rose every year - but in Year 3 its net profit fell, even though sales were higher. That is the question a manager needs to ask: what went wrong with costs in Year 3?
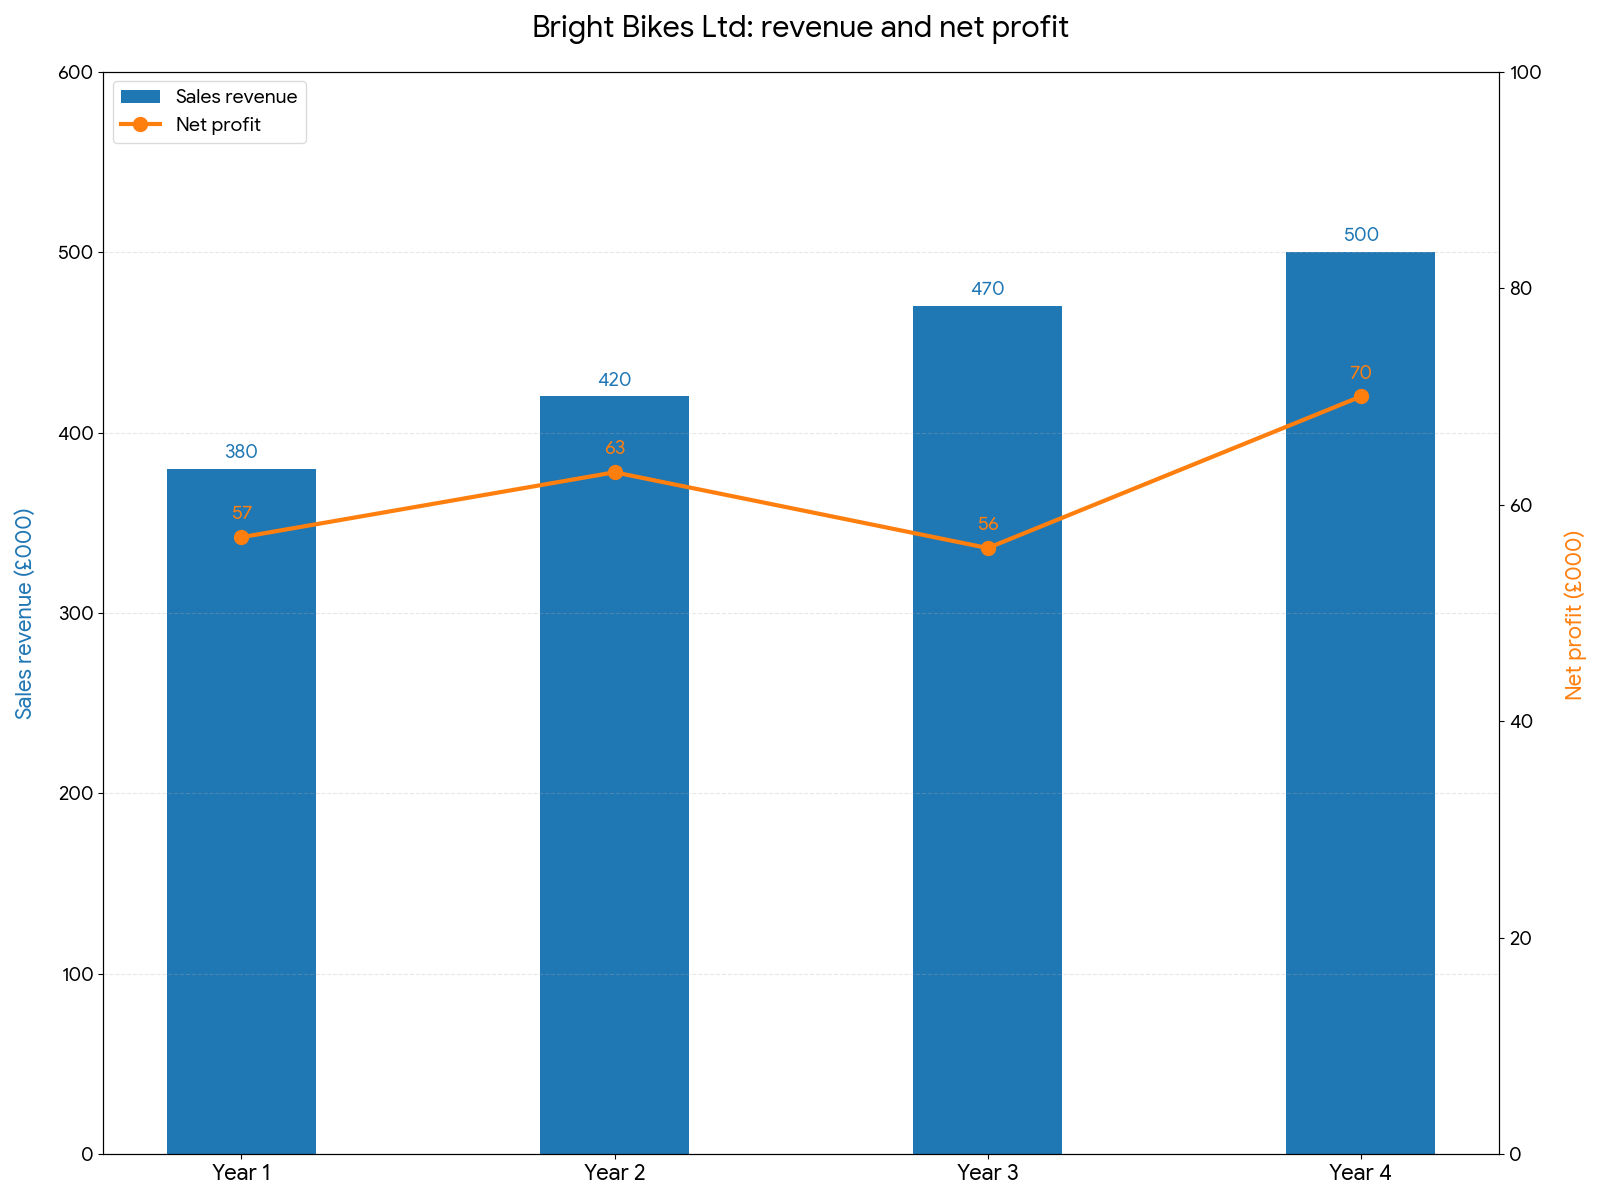
Revenue rose every year, but net profit fell in Year 3.
The Figures Behind the Chart
-
Year 1
Sales revenue: £380,000. Net profit: £57,000. Net profit margin: 15.0%
-
Year 2
Sales revenue: £420,000. Net profit: £63,000. Net profit margin: 15.0%
-
Year 3
Sales revenue: £470,000. Net profit: £56,000. Net profit margin: 11.9%
-
Year 4
Sales revenue: £500,000. Net profit: £70,000. Net profit margin: 14.0%
Interpreting the Data
What a manager learns from Bright Bikes' figures.
-
Trend
Revenue grew every year, by £120,000 over four years - the business is winning more customers.
-
Year 3
Net profit fell and the margin dropped to 11.9% - costs rose faster than sales.
-
Recovery
In Year 4 the margin recovered to 14%, suggesting costs were brought back under control.
-
The next question
Data shows what happened, but not always why - the manager needs to find out what caused the Year 3 costs.
Types of Business Data
-
Financial data
Revenue, costs, profit, margins, cash flow and ARR - how well the business is performing financially.
-
Market data
The size of the market, how fast it is growing, market share and what competitors are doing.
-
Marketing data
Results of promotions, website visits, customer feedback, sales by product and by segment.
Quantitative or Qualitative Data?
Quantitative data (numbers)
- Revenue, profit, margins, market share.
- Easy to compare over time and with competitors.
- Easy to present in graphs and charts.
- But: shows what happened, not why.
- Can be out of date, or based on forecasts that turn out wrong.
Qualitative data (opinions)
- Customer reviews, staff feedback, focus groups.
- Explains why customers and staff behave as they do.
- Gives ideas for improvement.
- But: harder to measure and compare.
- Can be biased, and based on a few people's views.
The Limitations of Financial Information
Financial data is vital, but it never tells the whole story.
-
It looks backwards
Accounts show what has already happened, not what will happen next.
-
It ignores non-financial factors
Staff morale, customer satisfaction and reputation do not appear in the accounts.
-
Forecasts may be wrong
Future figures, such as ARR returns, are estimates.
-
Context matters
A fall in profit may be due to a one-off cost or a recession, not poor management.
Which Investment?
Bright Bikes has £60,000 to invest. Option A: a new shop costing £60,000, with total returns of £90,000 over 5 years. Option B: a website upgrade costing £60,000, with total returns of £84,000 over 3 years. Calculate the ARR of each, recommend one, and give one non-financial factor Bright Bikes should also consider.
1. Calculate ARR for Option A.
2. Calculate ARR for Option B.
3. Recommend one.
4. Give a non-financial factor.
A good answer shows: Option A ARR 10% (£30,000 ÷ 5 = £6,000; £6,000 ÷ £60,000 × 100). Option B ARR 13.3% (£24,000 ÷ 3 = £8,000; £8,000 ÷ £60,000 × 100). A recommendation using ARR plus a non-financial factor such as staff or customer experience.
Can I...?
- 1Explain what ARR shows.
- 2Calculate average annual profit.
- 3Calculate ARR.
- 4Use ARR to compare investments.
- 5Interpret a graph of business data.
- 6Explain financial, market and marketing data.
- 7Explain the limits of quantitative and qualitative data.
- 8Explain the limits of financial information.
Summary & Exam Focus
- ARR = (average annual profit ÷ cost of investment) × 100.
- Graphs and charts reveal trends that tables hide.
- Financial, market and marketing data all inform decisions.
- Quantitative data shows what; qualitative data shows why; financial data has limits.
Exam focus
Calculate the average rate of return on an investment costing £50,000 that returns £70,000 in total over 5 years. (2 marks) (2 marks)
For ARR, subtract the cost first, then divide by the years, then by the cost. For data questions, quote the actual figures from the question in your answer.
Key terms
The vocabulary this lesson expects you to use. Each one is linked from the first place it appears above.
- Investment
- Spending money now in the hope of earning more in the future.
- Average rate of return (ARR)
- Average annual profit from an investment as a percentage of its cost.
- Financial data
- Information about a business's revenue, costs, profit and cash.
- Market data
- Information about the market, such as its size, growth and market share.
- Marketing data
- Information about the results of a business's marketing, such as sales and customer feedback.
- Quantitative data
- Data in the form of numbers.
- Qualitative data
- Data about opinions, feelings and reasons.
Downloads
Free to keep, print and annotate.
- Understanding business performance.pptx Built from the lesson script on 28 September 2026. View
- Understanding business performance - Completed Notes.docx The full notes for the lesson, to revise from. Built from the lesson script on 28 September 2026. View
- Understanding business performance - Exam Questions.docx Built from the lesson script on 28 September 2026. View
Something here looks wrong?
Tell us what and we will go and look. It goes to whoever writes these pages, nobody else, and we do not ask who you are — so there is nothing to sign and nothing comes back to you.