Exam questions · Maths · Statistics
Cumulative Frequency and Box Plots
- 6 exam questions
- 20 marks
- 9 quick checks
-
1 Complete [2 marks]
The table shows the frequencies of the masses of 60 people. The classes \(40 < m \leq 50\), \(50 < m \leq 60\), \(60 < m \leq 70\), \(70 < m \leq 80\), \(80 < m \leq 90\) and \(90 < m \leq 100\) have the frequencies 6, 9, 15, 15, 11 and 4. Write down the cumulative frequencies. [2 marks]
Show answerHide answer
Model answer
The running totals are 6, 15, 30, 45, 56 and 60.
Mark scheme
- At least four cumulative frequencies correct — M1
- 6, 15, 30, 45, 56, 60 — A1
-
2 Calculate [5 marks]
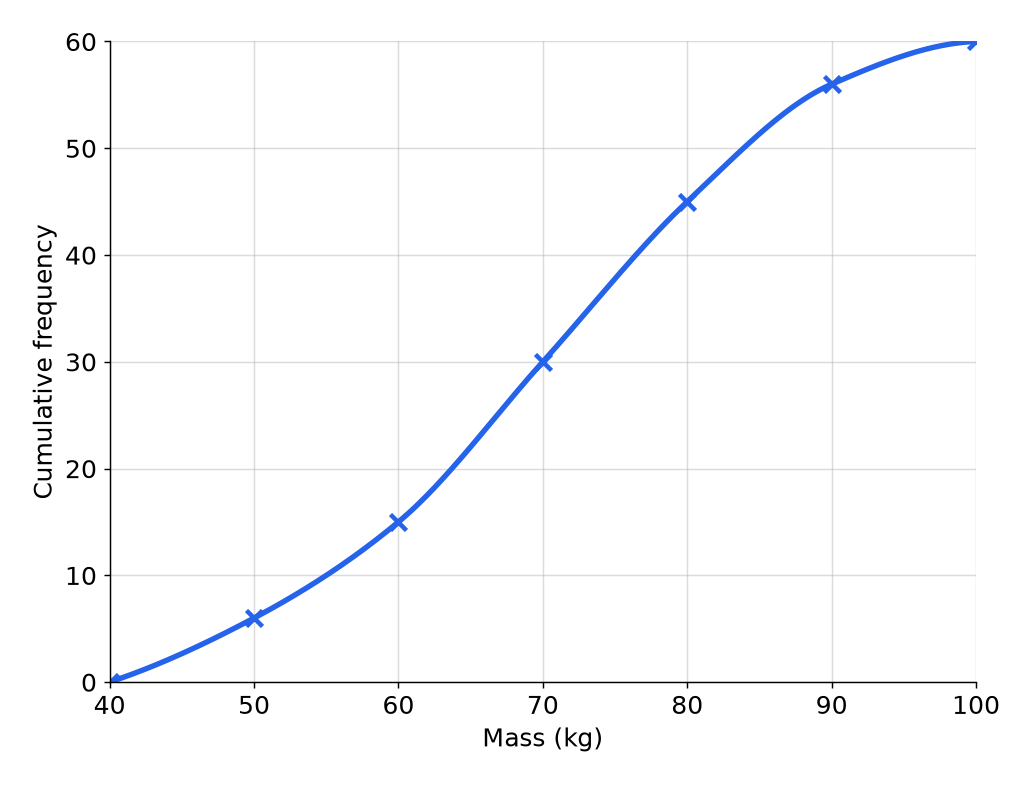
The cumulative frequency graph shows the masses of 60 people. (a) Use the graph to find an estimate for the median mass. [1 mark] (b) Use the graph to find an estimate for the interquartile range. [2 marks] (c) Use the graph to find an estimate for the number of people heavier than 90 kg. [2 marks]
Show answerHide answer
Model answer
(a) The median is at cumulative frequency 30, which is 70 kg. (b) The lower quartile is at 15, which is 60 kg, and the upper quartile is at 45, which is 80 kg. The interquartile range is \(80 - 60 = 20\) kg. (c) At 90 kg the cumulative frequency is 56, so \(60 - 56 = 4\) people are heavier.
Mark scheme
- (a) 70 (accept 69 to 71) — B1
- (b) Reads the quartiles at cumulative frequencies 15 and 45 — M1
- (b) 20 (accept 18 to 22) — A1
- (c) \(60 - 56\) — M1
- (c) 4 — A1
-
3 Compare [4 marks]
Box plot A shows the masses of Year 10 students: minimum 28, lower quartile 40, median 50, upper quartile 60 and maximum 76. Box plot B shows the masses of Year 11 students: minimum 40, lower quartile 52, median 56, upper quartile 64 and maximum 72. (a) Calculate the interquartile range for each. [2 marks] (b) Compare the masses of the Year 10 and Year 11 students. [2 marks]
Show answerHide answer
Model answer
(a) Year 10: \(60 - 40 = 20\). Year 11: \(64 - 52 = 12\). (b) The Year 11 students have a higher median, 56 kg compared with 50 kg, so they are typically heavier. Their interquartile range is smaller, 12 kg compared with 20 kg, so their masses are more consistent.
Mark scheme
- (a) 20 — B1
- (a) 12 — B1
- (b) A comparison of the medians, in context — B1
- (b) A comparison of the interquartile ranges, in context — B1
-
4 Calculate [3 marks]
A cumulative frequency graph is drawn for 200 values. (a) At what cumulative frequency should the lower quartile be read? [1 mark] (b) At what cumulative frequency should the upper quartile be read? [1 mark] (c) At what cumulative frequency should the 90th percentile be read? [1 mark]
Show answerHide answer
Model answer
(a) \(\dfrac{200}{4} = 50\). (b) \(\dfrac{3 \times 200}{4} = 150\). (c) \(0.9 \times 200 = 180\).
Mark scheme
- (a) 50 — B1
- (b) 150 — B1
- (c) 180 — B1
-
5 Calculate [3 marks]
The five-number summary for some data is minimum 15, lower quartile 22, median 30, upper quartile 41 and maximum 60. (a) Calculate the range and the interquartile range. [2 marks] (b) What percentage of the values lie between 22 and 41? [1 mark]
Show answerHide answer
Model answer
(a) Range \(60 - 15 = 45\) and interquartile range \(41 - 22 = 19\). (b) The box covers the middle half of the data, so 50%.
Mark scheme
- (a) 45 — B1
- (a) 19 — B1
- (b) 50% — B1
-
6 Calculate [3 marks]
A cumulative frequency graph of 120 values has a lower quartile of 35, a median of 48 and an upper quartile of 62. (a) How many values are less than 35? [1 mark] (b) How many values are between 35 and 62? [1 mark] (c) Calculate the interquartile range. [1 mark]
Show answerHide answer
Model answer
(a) \(\dfrac{120}{4} = 30\). (b) The middle half, \(\dfrac{120}{2} = 60\). (c) \(62 - 35 = 27\).
Mark scheme
- (a) 30 — B1
- (b) 60 — B1
- (c) 27 — B1
Quick check
-
1
For \(n\) values, where is the median on a cumulative frequency graph?
Show answerHide answer
A: At cumulative frequency \(\dfrac{n}{2}\)
The median is the middle value.
-
2
For 100 values, at what cumulative frequency is the lower quartile?
Show answerHide answer
D: \(25\)
\(\dfrac{100}{4} = 25\).
-
3
The upper quartile is 70 and the lower quartile is 40. What is the interquartile range?
Show answerHide answer
C: \(30\)
\(70 - 40 = 30\).
-
4
Frequencies 10, 15, 25, 20, 30 are added up as you go. What are the cumulative frequencies?
Show answerHide answer
B: \(10, 25, 50, 70, 100\)
Each is the running total.
-
5
Where should the points on a cumulative frequency graph be plotted?
Show answerHide answer
A: At the upper boundary of each class
The cumulative frequency is up to the end of the class.
-
6
A cumulative frequency graph of 100 students has a cumulative frequency of 90 at a mark of 80. How many scored more than 80?
Show answerHide answer
D: \(10\)
\(100 - 90 = 10\).
-
7
Class A has an interquartile range of 30 and Class B has 15. Which is more consistent?
Show answerHide answer
C: Class B, because its IQR is smaller
A smaller interquartile range means more consistent.
-
8
For 80 values, at what cumulative frequency is the upper quartile?
Show answerHide answer
B: \(60\)
\(\dfrac{3}{4} \times 80 = 60\).
-
9
A box plot for Class B has a median of 55, and Class A has a median of 50. What can you say?
Show answerHide answer
A: Class B has the higher typical mark
A higher median means a higher typical value.