Exam questions · Maths
Statistics
- 30 exam questions
- 96 marks
- 45 quick checks
Averages and Range
Just this lesson-
1 Calculate [3 marks]
Here are five numbers: 4, 6, 6, 7, 12. Calculate (a) the mean, (b) the median, (c) the range. [3 marks]
Show answerHide answer
Model answer
(a) \(\dfrac{4 + 6 + 6 + 7 + 12}{5} = \dfrac{35}{5} = 7\). (b) The numbers are in order, so the median is 6. (c) \(12 - 4 = 8\).
Mark scheme
- (a) 7 — B1
- (b) 6 — B1
- (c) 8 — B1
-
2 Calculate [5 marks]
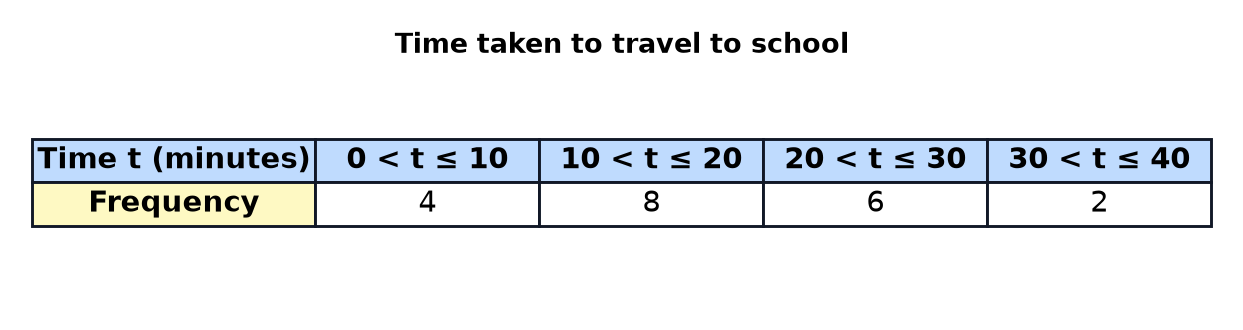
The table shows the times, \(t\) minutes, taken by 20 people to travel to school. (a) Write down the modal class. [1 mark] (b) Which class contains the median? [1 mark] (c) Calculate an estimate of the mean time. [3 marks]
Show answerHide answer
Model answer
(a) The highest frequency is 8, so the modal class is \(10 < t \leq 20\). (b) The median is halfway between the 10th and 11th values. The cumulative frequencies are 4, 12, 18, 20, so the median is in the class \(10 < t \leq 20\). (c) The mid-points are 5, 15, 25 and 35. \(5 \times 4 + 15 \times 8 + 25 \times 6 + 35 \times 2 = 20 + 120 + 150 + 70 = 360\). The estimate is \(\dfrac{360}{20} = 18\) minutes.
Mark scheme
- (a) \(10 < t \leq 20\) — B1
- (b) \(10 < t \leq 20\) — B1
- (c) Mid-points 5, 15, 25, 35 used — M1
- (c) \(\dfrac{360}{20}\) or total 360 — M1
- (c) 18 — A1
-
3 Calculate [3 marks]
Here are five numbers: 3, 5, 6, 7, 39. (a) Calculate the mean. [1 mark] (b) Find the median. [1 mark] (c) Which average is a better description of the typical number? Give a reason. [1 mark]
Show answerHide answer
Model answer
(a) \(\dfrac{3 + 5 + 6 + 7 + 39}{5} = \dfrac{60}{5} = 12\). (b) 6. (c) The median, because the mean is pulled up by the very large value 39, an outlier.
Mark scheme
- (a) 12 — B1
- (b) 6 — B1
- (c) The median, because the mean is affected by the outlier — B1
-
4 Calculate [3 marks]
10 pupils have a mean mark of 14. 30 other pupils have a mean mark of 18. Calculate the mean mark of all 40 pupils. [3 marks]
Show answerHide answer
Model answer
The total of the first group is \(10 \times 14 = 140\) and of the second is \(30 \times 18 = 540\). The mean is \(\dfrac{140 + 540}{40} = \dfrac{680}{40} = 17\).
Mark scheme
- \(10 \times 14 = 140\) or \(30 \times 18 = 540\) — M1
- \(\dfrac{140 + 540}{40}\) — M1
- 17 — A1
-
5 Calculate [3 marks]
The table shows the number of pets owned by 20 students. The numbers of pets 0, 1, 2 and 3 have the frequencies 5, 9, 4 and 2. Calculate the mean number of pets. [3 marks]
Show answerHide answer
Model answer
\(0 \times 5 + 1 \times 9 + 2 \times 4 + 3 \times 2 = 0 + 9 + 8 + 6 = 23\). The mean is \(\dfrac{23}{20} = 1.15\).
Mark scheme
- Products \(f \times x\) with at least 3 correct — M1
- \(\dfrac{23}{20}\) or total 23 — M1
- 1.15 — A1
-
6 Calculate [3 marks]
The mean of 5 numbers is 14. One of the numbers, 20, is removed. Calculate the mean of the remaining 4 numbers. [3 marks]
Show answerHide answer
Model answer
The total of the 5 numbers is \(5 \times 14 = 70\). After removing 20 the total is \(70 - 20 = 50\). The mean of the 4 numbers is \(\dfrac{50}{4} = 12.5\).
Mark scheme
- \(5 \times 14 = 70\) — M1
- \(\dfrac{70 - 20}{4}\) — M1
- 12.5 — A1
Quick check
-
1
What is the median of 3, 5, 6, 8, 9, 12?
Show answerHide answer
B: \(7\)
With 6 values, take the mean of the 3rd and 4th: \(\dfrac{6 + 8}{2} = 7\).
-
2
What is the range of 3, 8, 11, 20?
Show answerHide answer
A: \(17\)
\(20 - 3 = 17\).
-
3
What is the mean of 4, 6, 8, 10, 12?
Show answerHide answer
D: \(8\)
\(\dfrac{40}{5} = 8\).
-
4
Which average is least affected by an outlier?
Show answerHide answer
C: The median
The median depends only on the middle value.
-
5
The numbers 0, 1, 2, 3, 4 have frequencies 4, 4, 6, 4, 2. What is the mean?
Show answerHide answer
B: \(1.8\)
\(\dfrac{0 + 4 + 12 + 12 + 8}{20} = \dfrac{36}{20} = 1.8\).
-
6
What is the mode of the numbers 0, 1, 2, 3, 4 with frequencies 4, 4, 6, 4, 2?
Show answerHide answer
A: \(2\)
The highest frequency, 6, is for the value 2.
-
7
What is the mid-point of the class \(20 < w \leq 40\)?
Show answerHide answer
D: \(30\)
\(\dfrac{20 + 40}{2} = 30\).
-
8
Classes \(0 < w \leq 20\), \(20 < w \leq 40\) and \(40 < w \leq 60\) have frequencies 5, 10 and 5. What is the estimated mean?
Show answerHide answer
C: \(30\)
Using mid-points: \(\dfrac{10 \times 5 + 30 \times 10 + 50 \times 5}{20} = \dfrac{600}{20} = 30\).
-
9
The mean of five numbers is 8. Four of them are 5, 7, 9 and 10. What is the fifth?
Show answerHide answer
B: \(9\)
The total is \(5 \times 8 = 40\), and \(40 - 31 = 9\).
Pie Charts, Bar Charts and Stem-and-Leaf Diagrams
Just this lesson-
1 Calculate [3 marks]
45 students are asked how they travel to school. 18 walk, 15 take the bus, 9 cycle and 3 come by car. Calculate the angle for each type of travel in a pie chart. [3 marks]
Show answerHide answer
Model answer
Each student is \(\dfrac{360}{45} = 8^\circ\). Walk: \(18 \times 8 = 144^\circ\). Bus: \(15 \times 8 = 120^\circ\). Cycle: \(9 \times 8 = 72^\circ\). Car: \(3 \times 8 = 24^\circ\).
Mark scheme
- \(360 \div 45 = 8\) — M1
- At least two angles correct — A1
- \(144^\circ, 120^\circ, 72^\circ, 24^\circ\) — A1
-
2 Calculate [5 marks]
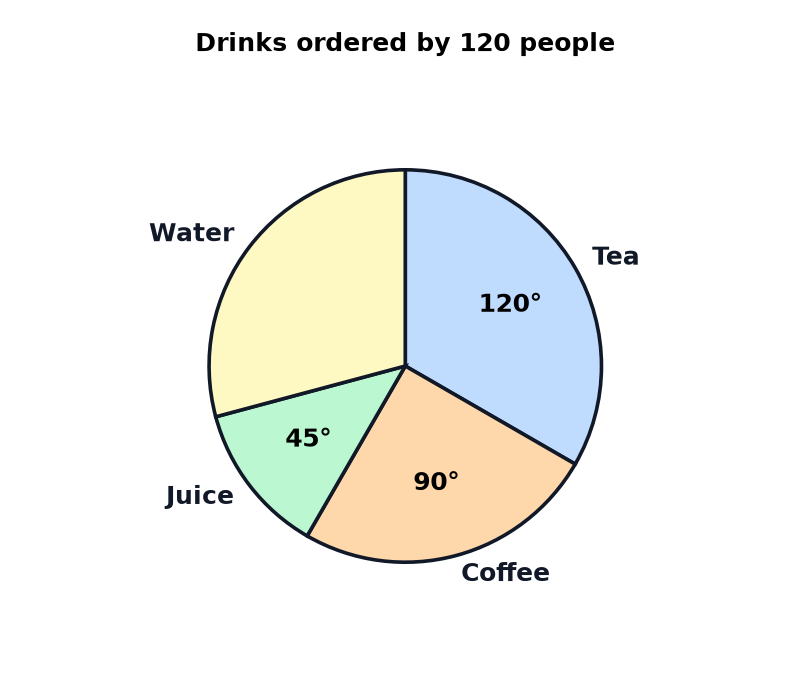
The pie chart shows the drinks ordered by 120 people in a cafe. The angle for water is not shown. (a) Calculate the number of people who ordered tea. [2 marks] (b) Calculate the angle for water. [1 mark] (c) Calculate the number of people who ordered water. [1 mark] (d) Write the sector for juice as a percentage of the whole pie chart. [1 mark]
Show answerHide answer
Model answer
(a) Each person is \(\dfrac{360}{120} = 3^\circ\), so tea is \(\dfrac{120}{3} = 40\). (b) \(360 - 120 - 90 - 45 = 105^\circ\). (c) \(\dfrac{105}{3} = 35\). (d) \(\dfrac{45}{360} = 12.5\%\).
Mark scheme
- (a) \(\dfrac{120}{360} \times 120\) or \(120 \div 3\) — M1
- (a) 40 — A1
- (b) \(105^\circ\) — B1
- (c) 35 — B1
- (d) 12.5% — B1
-
3 Find [4 marks]
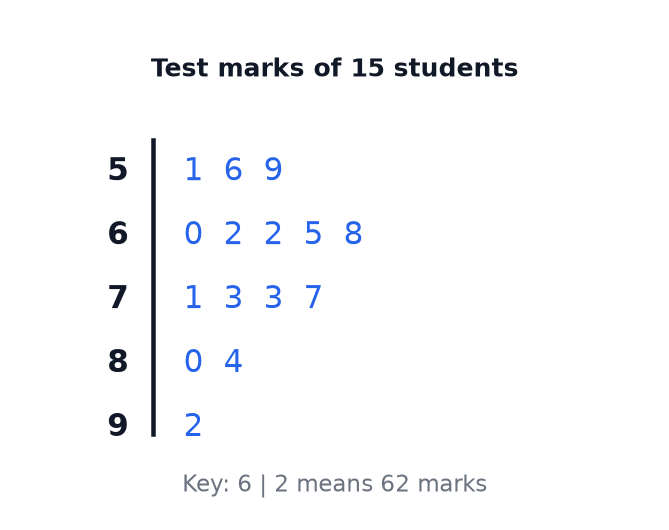
The stem-and-leaf diagram shows the marks of 15 students in a test. (a) How many students scored more than 70 marks? [1 mark] (b) Find the median mark. [1 mark] (c) Find the range. [1 mark] (d) Write down the modes. [1 mark]
Show answerHide answer
Model answer
(a) The marks above 70 are 71, 73, 73, 77, 80, 84 and 92, which is 7 students. (b) There are 15 values, so the median is the 8th value, 68. (c) \(92 - 51 = 41\). (d) 62 and 73 each occur twice.
Mark scheme
- (a) 7 — B1
- (b) 68 — B1
- (c) 41 — B1
- (d) 62 and 73 — B1
-
4 Explain [2 marks]
A graph has bars of different widths, and the horizontal scale jumps from 0 to 50 with no break shown. Give two reasons why the graph may be misleading. [2 marks]
Show answerHide answer
Model answer
Bars of different widths make the heights hard to compare, and the scale that jumps without a break gives a false impression of the sizes of the values.
Mark scheme
- The bars have different widths — B1
- The scale is uneven or has a jump — B1
-
5 Find [3 marks]
A stem-and-leaf diagram shows the times, in minutes, of 10 runners. The stem 1 has leaves 3, 6 and 8. The stem 2 has leaves 0, 2, 2, 5 and 9. The stem 3 has leaves 1 and 4. The key says that 2 bar 0 means 20 minutes. (a) Write down the number of runners with a time of more than 25 minutes. [1 mark] (b) Find the median time. [2 marks]
Show answerHide answer
Model answer
(a) The times above 25 are 29, 31 and 34, so 3 runners. (b) In order: 13, 16, 18, 20, 22, 22, 25, 29, 31, 34. The 5th and 6th values are both 22, so the median is 22 minutes.
Mark scheme
- (a) 3 — B1
- (b) The 5th and 6th values identified — M1
- (b) 22 — A1
-
6 Calculate [3 marks]
Pie chart A shows the travel of 60 people. The angle for tea is \(120^\circ\). Pie chart B shows the travel of 90 people. The angle for tea is \(100^\circ\). Compare the number of people who have tea in the two charts, and the proportion. [3 marks]
Show answerHide answer
Model answer
Chart A: \(\dfrac{120}{360} \times 60 = 20\) people, which is \(\dfrac{1}{3}\) of the people. Chart B: \(\dfrac{100}{360} \times 90 = 25\) people, which is \(\dfrac{5}{18}\) of the people. More people have tea in chart B, but a bigger proportion of the people have tea in chart A.
Mark scheme
- \(\dfrac{120}{360} \times 60 = 20\) and \(\dfrac{100}{360} \times 90 = 25\) — M1
- A comparison of the numbers, 25 and 20 — A1
- A comparison of the proportions, with a conclusion — A1
Quick check
-
1
60 students choose a sport. 24 choose football. What is the angle for football on a pie chart?
Show answerHide answer
C: \(144^\circ\)
Each student is \(\dfrac{360}{60} = 6^\circ\), so \(24 \times 6 = 144^\circ\).
-
2
A pie chart shows 40 people. How many degrees represent each person?
Show answerHide answer
B: \(9^\circ\)
\(\dfrac{360}{40} = 9\).
-
3
A pie chart shows 36 people. A sector is \(100^\circ\). How many people does it represent?
Show answerHide answer
A: \(10\)
\(\dfrac{100}{360} \times 36 = 10\).
-
4
What fraction of a pie chart is a \(90^\circ\) sector?
Show answerHide answer
D: \(\dfrac{1}{4}\)
\(\dfrac{90}{360} = \dfrac{1}{4}\).
-
5
What must every stem-and-leaf diagram have?
Show answerHide answer
C: A key
Without a key the values cannot be read.
-
6
A stem-and-leaf diagram has 14 ordered values. The 7th is 26 and the 8th is 29. What is the median?
Show answerHide answer
B: \(27.5\)
\(\dfrac{26 + 29}{2} = 27.5\).
-
7
The values in a stem-and-leaf diagram run from 12 to 45. What is the range?
Show answerHide answer
A: \(33\)
\(45 - 12 = 33\).
-
8
Which of these makes a bar chart misleading?
Show answerHide answer
D: The vertical scale does not start at zero
A scale that does not start at zero exaggerates differences.
-
9
On a pie chart for 60 people, a sector is \(54^\circ\). What percentage is that?
Show answerHide answer
C: \(15\%\)
\(\dfrac{54}{360} = 0.15\).
Scatter Graphs
Just this lesson-
1 Write down [2 marks]
Write down the type of correlation between (a) the temperature and the number of hot drinks sold, (b) the shoe size and the age of children. [2 marks]
Show answerHide answer
Model answer
(a) Negative correlation. (b) Positive correlation.
Mark scheme
- (a) Negative — B1
- (b) Positive — B1
-
2 Estimate [5 marks]
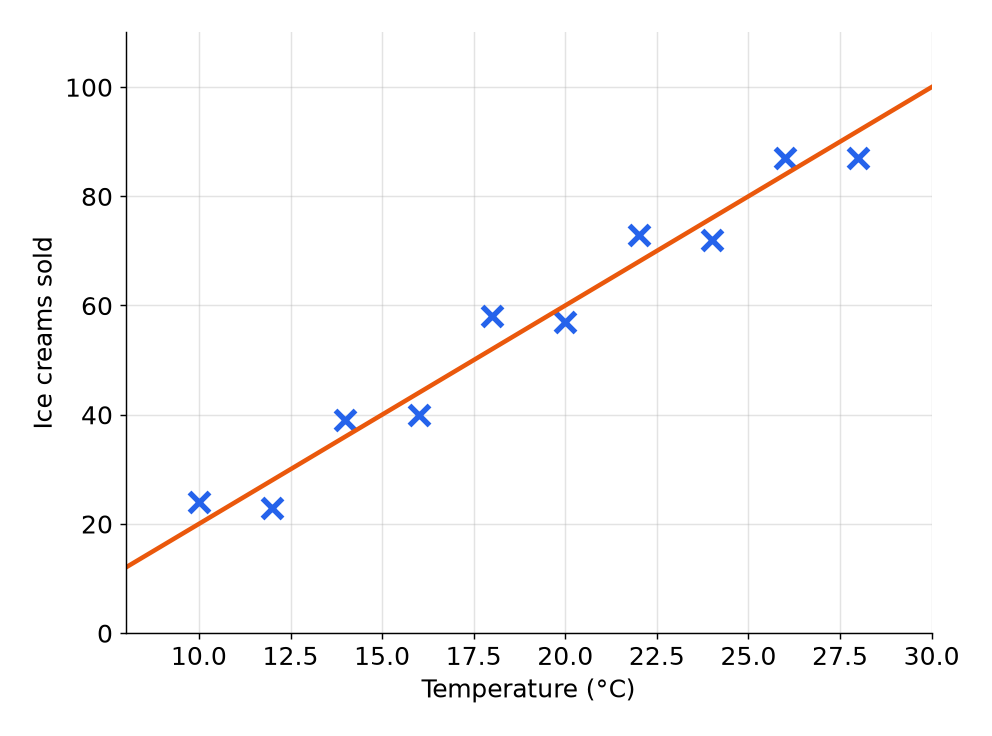
The scatter graph shows the temperature and the number of ice creams sold by a shop. A line of best fit is drawn. (a) Describe the relationship between the temperature and the number of ice creams sold. [1 mark] (b) Use the line of best fit to estimate the number of ice creams sold when the temperature is 20 degrees. [2 marks] (c) Use the line of best fit to estimate the temperature when 88 ice creams were sold. [2 marks]
Show answerHide answer
Model answer
(a) As the temperature increases, the number of ice creams sold increases. (b) Going up from 20 degrees to the line and across gives 60. (c) Going across from 88 on the vertical axis to the line and down gives 27 degrees.
Mark scheme
- (a) As the temperature increases, the sales increase — B1
- (b) A line drawn up from 20 to the line of best fit and across — M1
- (b) 60 (accept 58 to 62) — A1
- (c) A line drawn across from 88 to the line of best fit and down — M1
- (c) 27 (accept 26 to 28) — A1
-
3 Calculate [3 marks]
A line of best fit for the hours of revision, \(x\), and the test score, \(y\), has the equation \(y = 2x + 8\). (a) Use the equation to estimate the score for 20 hours of revision. [1 mark] (b) Mia uses the equation to estimate the score for 60 hours of revision. Calculate her estimate. [1 mark] (c) Explain why her estimate is not reliable. [1 mark]
Show answerHide answer
Model answer
(a) \(2 \times 20 + 8 = 48\). (b) \(2 \times 60 + 8 = 128\). (c) The estimate is outside the range of the data, and it is above the maximum possible score of 100.
Mark scheme
- (a) 48 — B1
- (b) 128 — B1
- (c) Outside the range of the data, or higher than the maximum score — B1
-
4 Explain [2 marks]
There is a strong positive correlation between the number of fire engines at a fire and the amount of damage. Does this show that the fire engines cause the damage? Explain your answer. [2 marks]
Show answerHide answer
Model answer
No. Correlation does not show causation. A bigger fire needs more fire engines and also causes more damage.
Mark scheme
- No, correlation does not show causation — B1
- A third factor, such as the size of the fire — B1
-
5 Calculate [3 marks]
A line of best fit goes through the points \((0, 6)\) and \((20, 16)\). (a) Calculate the gradient of the line. [1 mark] (b) Write down the equation of the line. [1 mark] (c) Use your equation to estimate \(y\) when \(x = 14\). [1 mark]
Show answerHide answer
Model answer
(a) \(\dfrac{16 - 6}{20 - 0} = 0.5\). (b) \(y = 0.5x + 6\). (c) \(0.5 \times 14 + 6 = 13\).
Mark scheme
- (a) 0.5 — B1
- (b) \(y = 0.5x + 6\) — B1
- (c) 13 — B1 (follow through from (b))
-
6 Calculate [3 marks]
Ben draws a line of best fit through the points \((10, 8)\) and \((30, 48)\). (a) Calculate the gradient. [1 mark] (b) Find the equation of the line in the form \(y = mx + c\). [2 marks]
Show answerHide answer
Model answer
(a) \(\dfrac{48 - 8}{30 - 10} = 2\). (b) \(8 = 2 \times 10 + c\), so \(c = -12\) and \(y = 2x - 12\).
Mark scheme
- (a) 2 — B1
- (b) Substitutes a point to find \(c\) — M1
- (b) \(y = 2x - 12\) — A1
Quick check
-
1
What type of correlation has points sloping downwards from left to right?
Show answerHide answer
D: Negative
One variable falls as the other rises.
-
2
Which statement describes positive correlation?
Show answerHide answer
C: As one variable increases, the other increases
Positive correlation slopes upwards.
-
3
What is an outlier?
Show answerHide answer
B: A point that does not fit the pattern of the others
Outliers are far from the trend.
-
4
A line of best fit has equation \(y = 4x + 8\). Estimate \(y\) when \(x = 12\).
Show answerHide answer
A: \(56\)
\(4 \times 12 + 8 = 56\).
-
5
Data runs from 2 to 16 hours of revision. What do we call an estimate for 25 hours?
Show answerHide answer
D: Extrapolation
Outside the range of the data is extrapolation.
-
6
Which estimate is likely to be more reliable?
Show answerHide answer
C: One inside the range of the data
Interpolation is more reliable than extrapolation.
-
7
Ice cream sales and sunburn are positively correlated. What is the best explanation?
Show answerHide answer
B: Hot weather increases both
A third factor can cause both.
-
8
The line of best fit is \(y = 4x + 8\), where \(x\) is hours of revision and \(y\) is the test score. What does the gradient mean?
Show answerHide answer
A: Each extra hour of revision adds about 4 marks
The gradient is the change in score for each extra hour.
-
9
In \(y = 4x + 8\), what does 8 represent?
Show answerHide answer
D: The estimated score with no revision
It is the \(y\)-intercept, the value when \(x = 0\).
Cumulative Frequency and Box Plots
Just this lesson-
1 Complete [2 marks]
The table shows the frequencies of the masses of 60 people. The classes \(40 < m \leq 50\), \(50 < m \leq 60\), \(60 < m \leq 70\), \(70 < m \leq 80\), \(80 < m \leq 90\) and \(90 < m \leq 100\) have the frequencies 6, 9, 15, 15, 11 and 4. Write down the cumulative frequencies. [2 marks]
Show answerHide answer
Model answer
The running totals are 6, 15, 30, 45, 56 and 60.
Mark scheme
- At least four cumulative frequencies correct — M1
- 6, 15, 30, 45, 56, 60 — A1
-
2 Calculate [5 marks]
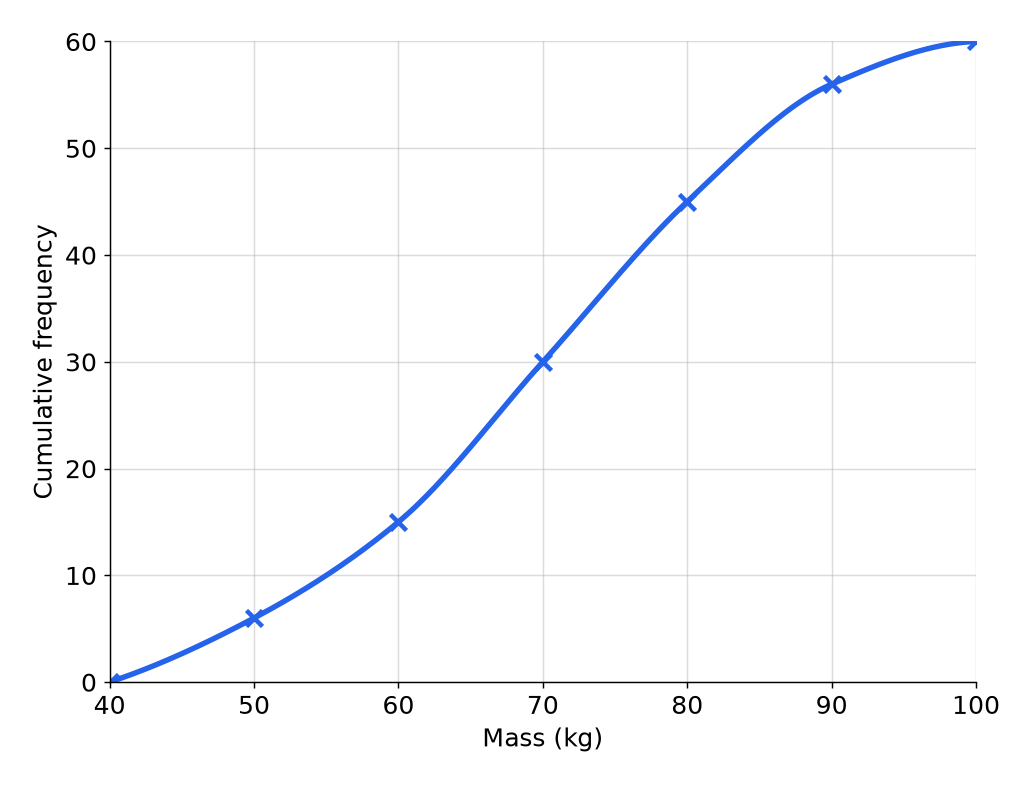
The cumulative frequency graph shows the masses of 60 people. (a) Use the graph to find an estimate for the median mass. [1 mark] (b) Use the graph to find an estimate for the interquartile range. [2 marks] (c) Use the graph to find an estimate for the number of people heavier than 90 kg. [2 marks]
Show answerHide answer
Model answer
(a) The median is at cumulative frequency 30, which is 70 kg. (b) The lower quartile is at 15, which is 60 kg, and the upper quartile is at 45, which is 80 kg. The interquartile range is \(80 - 60 = 20\) kg. (c) At 90 kg the cumulative frequency is 56, so \(60 - 56 = 4\) people are heavier.
Mark scheme
- (a) 70 (accept 69 to 71) — B1
- (b) Reads the quartiles at cumulative frequencies 15 and 45 — M1
- (b) 20 (accept 18 to 22) — A1
- (c) \(60 - 56\) — M1
- (c) 4 — A1
-
3 Compare [4 marks]
Box plot A shows the masses of Year 10 students: minimum 28, lower quartile 40, median 50, upper quartile 60 and maximum 76. Box plot B shows the masses of Year 11 students: minimum 40, lower quartile 52, median 56, upper quartile 64 and maximum 72. (a) Calculate the interquartile range for each. [2 marks] (b) Compare the masses of the Year 10 and Year 11 students. [2 marks]
Show answerHide answer
Model answer
(a) Year 10: \(60 - 40 = 20\). Year 11: \(64 - 52 = 12\). (b) The Year 11 students have a higher median, 56 kg compared with 50 kg, so they are typically heavier. Their interquartile range is smaller, 12 kg compared with 20 kg, so their masses are more consistent.
Mark scheme
- (a) 20 — B1
- (a) 12 — B1
- (b) A comparison of the medians, in context — B1
- (b) A comparison of the interquartile ranges, in context — B1
-
4 Calculate [3 marks]
A cumulative frequency graph is drawn for 200 values. (a) At what cumulative frequency should the lower quartile be read? [1 mark] (b) At what cumulative frequency should the upper quartile be read? [1 mark] (c) At what cumulative frequency should the 90th percentile be read? [1 mark]
Show answerHide answer
Model answer
(a) \(\dfrac{200}{4} = 50\). (b) \(\dfrac{3 \times 200}{4} = 150\). (c) \(0.9 \times 200 = 180\).
Mark scheme
- (a) 50 — B1
- (b) 150 — B1
- (c) 180 — B1
-
5 Calculate [3 marks]
The five-number summary for some data is minimum 15, lower quartile 22, median 30, upper quartile 41 and maximum 60. (a) Calculate the range and the interquartile range. [2 marks] (b) What percentage of the values lie between 22 and 41? [1 mark]
Show answerHide answer
Model answer
(a) Range \(60 - 15 = 45\) and interquartile range \(41 - 22 = 19\). (b) The box covers the middle half of the data, so 50%.
Mark scheme
- (a) 45 — B1
- (a) 19 — B1
- (b) 50% — B1
-
6 Calculate [3 marks]
A cumulative frequency graph of 120 values has a lower quartile of 35, a median of 48 and an upper quartile of 62. (a) How many values are less than 35? [1 mark] (b) How many values are between 35 and 62? [1 mark] (c) Calculate the interquartile range. [1 mark]
Show answerHide answer
Model answer
(a) \(\dfrac{120}{4} = 30\). (b) The middle half, \(\dfrac{120}{2} = 60\). (c) \(62 - 35 = 27\).
Mark scheme
- (a) 30 — B1
- (b) 60 — B1
- (c) 27 — B1
Quick check
-
1
For \(n\) values, where is the median on a cumulative frequency graph?
Show answerHide answer
A: At cumulative frequency \(\dfrac{n}{2}\)
The median is the middle value.
-
2
For 100 values, at what cumulative frequency is the lower quartile?
Show answerHide answer
D: \(25\)
\(\dfrac{100}{4} = 25\).
-
3
The upper quartile is 70 and the lower quartile is 40. What is the interquartile range?
Show answerHide answer
C: \(30\)
\(70 - 40 = 30\).
-
4
Frequencies 10, 15, 25, 20, 30 are added up as you go. What are the cumulative frequencies?
Show answerHide answer
B: \(10, 25, 50, 70, 100\)
Each is the running total.
-
5
Where should the points on a cumulative frequency graph be plotted?
Show answerHide answer
A: At the upper boundary of each class
The cumulative frequency is up to the end of the class.
-
6
A cumulative frequency graph of 100 students has a cumulative frequency of 90 at a mark of 80. How many scored more than 80?
Show answerHide answer
D: \(10\)
\(100 - 90 = 10\).
-
7
Class A has an interquartile range of 30 and Class B has 15. Which is more consistent?
Show answerHide answer
C: Class B, because its IQR is smaller
A smaller interquartile range means more consistent.
-
8
For 80 values, at what cumulative frequency is the upper quartile?
Show answerHide answer
B: \(60\)
\(\dfrac{3}{4} \times 80 = 60\).
-
9
A box plot for Class B has a median of 55, and Class A has a median of 50. What can you say?
Show answerHide answer
A: Class B has the higher typical mark
A higher median means a higher typical value.
Histograms and Sampling
Just this lesson-
1 Calculate [3 marks]
The table shows the ages of some people. For the class \(0 < a \leq 10\) the frequency is 5, for \(10 < a \leq 30\) it is 30, and for \(30 < a \leq 50\) it is 60. Calculate the frequency density for each class. [3 marks]
Show answerHide answer
Model answer
The widths are 10, 20 and 20. The frequency densities are \(\dfrac{5}{10} = 0.5\), \(\dfrac{30}{20} = 1.5\) and \(\dfrac{60}{20} = 3\).
Mark scheme
- Class widths 10, 20 and 20 used — M1
- At least two frequency densities correct — A1
- 0.5, 1.5 and 3 — A1
-
2 Calculate [4 marks]
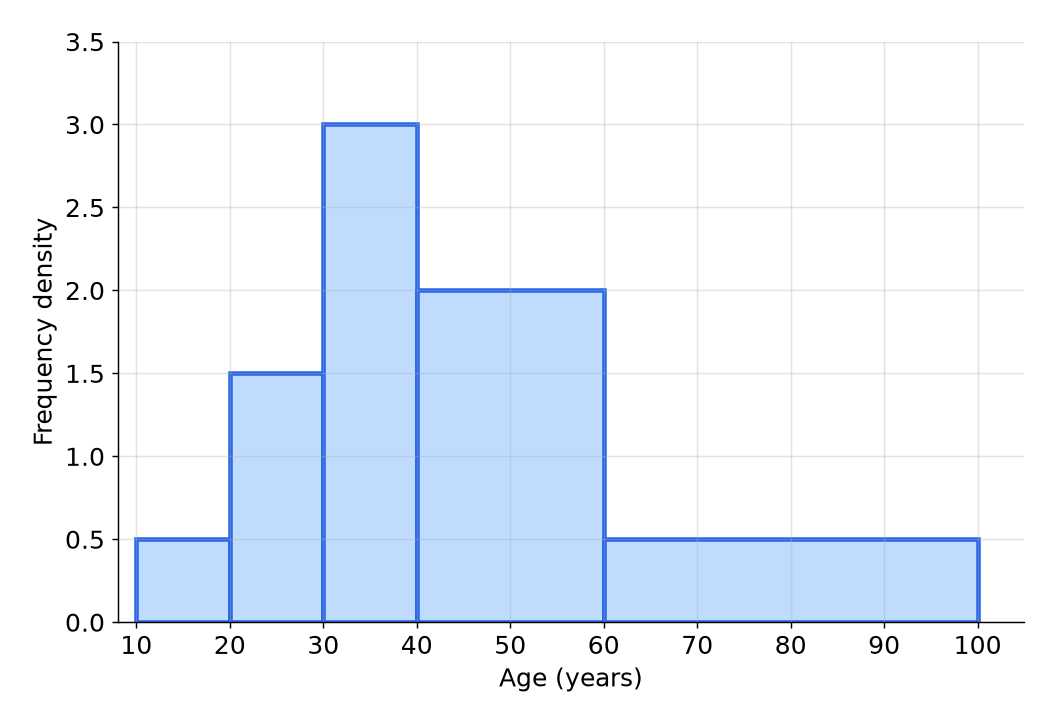
The histogram shows the ages of some people at a village event. (a) Calculate the number of people aged more than 40 and up to 60. [2 marks] (b) Calculate the number of people aged over 60. [2 marks]
Show answerHide answer
Model answer
(a) The frequency is the area of the bar: \(2 \times 20 = 40\). (b) The bar from 60 to 100 has a frequency density of 0.5 and a width of 40, so \(0.5 \times 40 = 20\).
Mark scheme
- (a) \(2 \times 20\) — M1
- (a) 40 — A1
- (b) \(0.5 \times 40\) — M1
- (b) 20 — A1
-
3 Calculate [3 marks]
On a histogram the bar for the class \(20 < x \leq 40\) has a frequency density of 2.5. (a) Calculate the frequency of the class. [2 marks] The class \(40 < x \leq 50\) has a frequency of 30. (b) Calculate the height of its bar. [1 mark]
Show answerHide answer
Model answer
(a) The width is 20, so the frequency is \(2.5 \times 20 = 50\). (b) The width is 10, so the frequency density is \(\dfrac{30}{10} = 3\).
Mark scheme
- (a) \(2.5 \times 20\) — M1
- (a) 50 — A1
- (b) 3 — B1
-
4 Calculate [3 marks]
A club has 90 juniors, 60 seniors and 30 veterans. A stratified sample of 36 members is taken. Calculate the number of members from each group in the sample. [3 marks]
Show answerHide answer
Model answer
There are 180 members. Juniors: \(\dfrac{90}{180} \times 36 = 18\). Seniors: \(\dfrac{60}{180} \times 36 = 12\). Veterans: \(\dfrac{30}{180} \times 36 = 6\).
Mark scheme
- \(\dfrac{90}{180} \times 36\) or the total 180 seen — M1
- At least two numbers correct — A1
- 18, 12 and 6 — A1
-
5 Calculate [3 marks]
A farmer marks 25 sheep in a flock. Later he selects 50 sheep, and 5 of them are marked. (a) Calculate an estimate for the number of sheep in the flock. [2 marks] (b) State one assumption you have made. [1 mark]
Show answerHide answer
Model answer
(a) \(\dfrac{5}{50} = \dfrac{25}{N}\), so \(N = \dfrac{25 \times 50}{5} = 250\). (b) The marked sheep have mixed evenly with the others, and the size of the flock has not changed.
Mark scheme
- (a) \(\dfrac{25 \times 50}{5}\) — M1
- (a) 250 — A1
- (b) The marked sheep have mixed evenly, or the population has not changed — B1
-
6 Describe [2 marks]
There are 800 students in a school. Describe how to take a random sample of 20 of them. [2 marks]
Show answerHide answer
Model answer
Give each student a different number from 1 to 800. Use a random number generator to pick 20 different numbers, and choose the students with those numbers.
Mark scheme
- Numbers each of the students — B1
- Uses random numbers to choose 20 students — B1
Quick check
-
1
What is the formula for frequency density?
Show answerHide answer
B: Frequency divided by class width
Frequency density \(= \dfrac{\text{frequency}}{\text{class width}}\).
-
2
What does the area of a bar in a histogram show?
Show answerHide answer
A: The frequency
Area \(=\) frequency density \(\times\) class width \(=\) frequency.
-
3
A histogram bar has class width 20 and frequency density 3. What is the frequency?
Show answerHide answer
D: \(60\)
\(3 \times 20 = 60\).
-
4
A class of width 10 has frequency 30. What is its frequency density?
Show answerHide answer
C: \(3\)
\(\dfrac{30}{10} = 3\).
-
5
A survey about exercise only asks people leaving a gym. What is wrong with the sample?
Show answerHide answer
B: It is biased towards people who exercise
People at a gym are not typical of the whole population.
-
6
A school has 600 pupils, 240 in Year 10. A stratified sample of 50 is taken. How many Year 10 pupils are in the sample?
Show answerHide answer
A: \(20\)
\(\dfrac{240}{600} \times 50 = 20\).
-
7
50 fish are marked and released. A second sample of 40 fish contains 8 marked fish. What is the estimate of the population?
Show answerHide answer
D: \(250\)
\(\dfrac{50 \times 40}{8} = 250\).
-
8
A histogram bar from 30 to 40 has frequency 40. Estimate the number of values from 30 to 35.
Show answerHide answer
C: \(20\)
35 is halfway through the class, so about half the frequency: 20.
-
9
Why does a larger sample usually give a better estimate?
Show answerHide answer
B: It is more likely to represent the whole population
Bigger samples are less affected by chance.