Exam questions · Maths · Statistics
Histograms and Sampling
- 6 exam questions
- 18 marks
- 9 quick checks
-
1 Calculate [3 marks]
The table shows the ages of some people. For the class \(0 < a \leq 10\) the frequency is 5, for \(10 < a \leq 30\) it is 30, and for \(30 < a \leq 50\) it is 60. Calculate the frequency density for each class. [3 marks]
Show answerHide answer
Model answer
The widths are 10, 20 and 20. The frequency densities are \(\dfrac{5}{10} = 0.5\), \(\dfrac{30}{20} = 1.5\) and \(\dfrac{60}{20} = 3\).
Mark scheme
- Class widths 10, 20 and 20 used — M1
- At least two frequency densities correct — A1
- 0.5, 1.5 and 3 — A1
-
2 Calculate [4 marks]
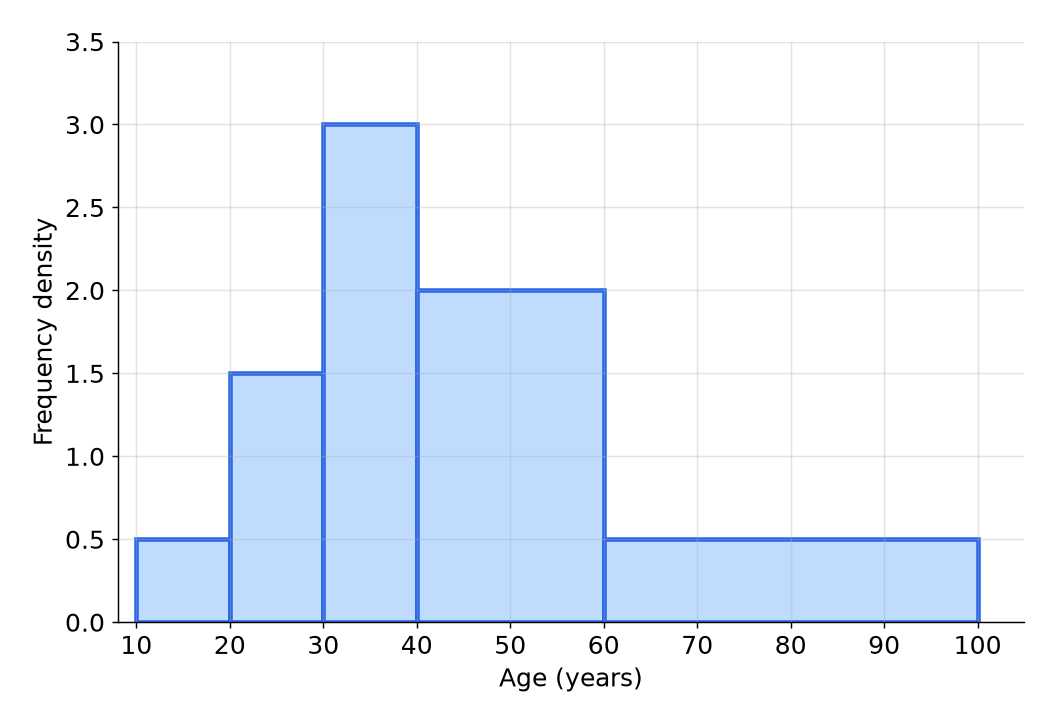
The histogram shows the ages of some people at a village event. (a) Calculate the number of people aged more than 40 and up to 60. [2 marks] (b) Calculate the number of people aged over 60. [2 marks]
Show answerHide answer
Model answer
(a) The frequency is the area of the bar: \(2 \times 20 = 40\). (b) The bar from 60 to 100 has a frequency density of 0.5 and a width of 40, so \(0.5 \times 40 = 20\).
Mark scheme
- (a) \(2 \times 20\) — M1
- (a) 40 — A1
- (b) \(0.5 \times 40\) — M1
- (b) 20 — A1
-
3 Calculate [3 marks]
On a histogram the bar for the class \(20 < x \leq 40\) has a frequency density of 2.5. (a) Calculate the frequency of the class. [2 marks] The class \(40 < x \leq 50\) has a frequency of 30. (b) Calculate the height of its bar. [1 mark]
Show answerHide answer
Model answer
(a) The width is 20, so the frequency is \(2.5 \times 20 = 50\). (b) The width is 10, so the frequency density is \(\dfrac{30}{10} = 3\).
Mark scheme
- (a) \(2.5 \times 20\) — M1
- (a) 50 — A1
- (b) 3 — B1
-
4 Calculate [3 marks]
A club has 90 juniors, 60 seniors and 30 veterans. A stratified sample of 36 members is taken. Calculate the number of members from each group in the sample. [3 marks]
Show answerHide answer
Model answer
There are 180 members. Juniors: \(\dfrac{90}{180} \times 36 = 18\). Seniors: \(\dfrac{60}{180} \times 36 = 12\). Veterans: \(\dfrac{30}{180} \times 36 = 6\).
Mark scheme
- \(\dfrac{90}{180} \times 36\) or the total 180 seen — M1
- At least two numbers correct — A1
- 18, 12 and 6 — A1
-
5 Calculate [3 marks]
A farmer marks 25 sheep in a flock. Later he selects 50 sheep, and 5 of them are marked. (a) Calculate an estimate for the number of sheep in the flock. [2 marks] (b) State one assumption you have made. [1 mark]
Show answerHide answer
Model answer
(a) \(\dfrac{5}{50} = \dfrac{25}{N}\), so \(N = \dfrac{25 \times 50}{5} = 250\). (b) The marked sheep have mixed evenly with the others, and the size of the flock has not changed.
Mark scheme
- (a) \(\dfrac{25 \times 50}{5}\) — M1
- (a) 250 — A1
- (b) The marked sheep have mixed evenly, or the population has not changed — B1
-
6 Describe [2 marks]
There are 800 students in a school. Describe how to take a random sample of 20 of them. [2 marks]
Show answerHide answer
Model answer
Give each student a different number from 1 to 800. Use a random number generator to pick 20 different numbers, and choose the students with those numbers.
Mark scheme
- Numbers each of the students — B1
- Uses random numbers to choose 20 students — B1
Quick check
-
1
What is the formula for frequency density?
Show answerHide answer
B: Frequency divided by class width
Frequency density \(= \dfrac{\text{frequency}}{\text{class width}}\).
-
2
What does the area of a bar in a histogram show?
Show answerHide answer
A: The frequency
Area \(=\) frequency density \(\times\) class width \(=\) frequency.
-
3
A histogram bar has class width 20 and frequency density 3. What is the frequency?
Show answerHide answer
D: \(60\)
\(3 \times 20 = 60\).
-
4
A class of width 10 has frequency 30. What is its frequency density?
Show answerHide answer
C: \(3\)
\(\dfrac{30}{10} = 3\).
-
5
A survey about exercise only asks people leaving a gym. What is wrong with the sample?
Show answerHide answer
B: It is biased towards people who exercise
People at a gym are not typical of the whole population.
-
6
A school has 600 pupils, 240 in Year 10. A stratified sample of 50 is taken. How many Year 10 pupils are in the sample?
Show answerHide answer
A: \(20\)
\(\dfrac{240}{600} \times 50 = 20\).
-
7
50 fish are marked and released. A second sample of 40 fish contains 8 marked fish. What is the estimate of the population?
Show answerHide answer
D: \(250\)
\(\dfrac{50 \times 40}{8} = 250\).
-
8
A histogram bar from 30 to 40 has frequency 40. Estimate the number of values from 30 to 35.
Show answerHide answer
C: \(20\)
35 is halfway through the class, so about half the frequency: 20.
-
9
Why does a larger sample usually give a better estimate?
Show answerHide answer
B: It is more likely to represent the whole population
Bigger samples are less affected by chance.