1.5 Growth and percentile charts
6 exam questions worth 12 marks. Write your answer, open the mark scheme, then give yourself the marks you earned. Your answers are saved on this device.
0 / 12
A baby's mass is on the 25th percentile for babies of the same age and sex.
What does this mean?
Choose one answer.
Correct Not quite: the answer is 25 out of every 100 babies of that age and sex are lighter
Mark scheme
A (25 out of every 100 babies of that age and sex are lighter)
Model answer
A: 25 out of every 100 babies of that age and sex are lighter. On the 25th percentile, 25% of babies are lighter and 75% are heavier.
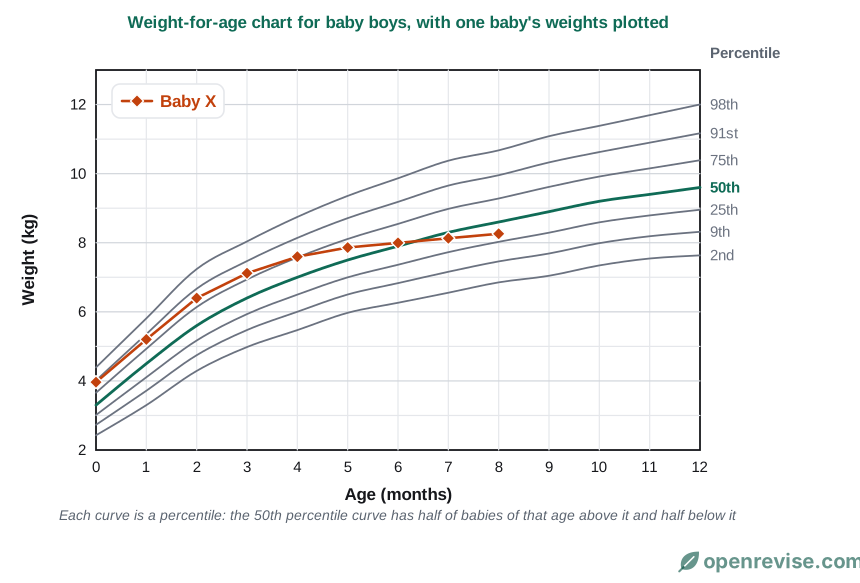
(a) Use the chart to find the 50th percentile weight for a boy aged 6 months. (1 mark)
(b) Baby X was weighed at 6 months. Which percentile curve is closest to Baby X's weight at 6 months? (1 mark)
Mark scheme
(a) 7.9 (kg) (1) (allow 7.8 to 8.0)
(b) 50th (percentile) (1)
Model answer
(a) About 7.9 kg.
(b) Baby X's weight at 6 months is close to the 50th percentile curve.
Describe how Baby X's weight changed compared with the percentile curves between birth and 8 months, and suggest what a health visitor should do.
Mark scheme
- at birth Baby X was on about the 91st percentile (1)
- by 8 months the weight was between the 25th and 50th percentiles / the weight had crossed several curves / growth had slowed (1)
- the health visitor should investigate / check the baby's feeding or health / monitor the baby more often (1)
Model answer
At birth Baby X was on about the 91st percentile, but by 8 months the weight was between the 25th and 50th percentiles, so it had fallen across several curves. This shows that growth has slowed, so the health visitor should check Baby X's feeding and health and weigh the baby more often.
Explain why doctors use percentile charts rather than only recording a baby's mass.
Mark scheme
- they allow the baby to be compared with other babies of the same age (and sex) (1)
- they show whether growth follows the expected pattern over time, so problems can be spotted early (1)
Model answer
A percentile chart compares the baby with other healthy babies of the same age and sex, and it shows whether growth follows the expected pattern, so a problem can be spotted early.
A baby girl's length at 6 months is on the 75th percentile.
In a group of 200 girls of the same age, how many would be expected to be shorter than this baby?
Mark scheme
- 75% of 200 / 0.75 × 200 / 200 × 75 ÷ 100 (1)
- = 150 (1)
Model answer
75% of 200 = 0.75 × 200 = 150 girls.
Suggest two reasons why a baby's weight might fall across the percentile curves.
Mark scheme
Any two from:
- illness / infection (1)
- not enough food / feeding problems (1)
- the baby is unable to absorb enough nutrients (1)
- allow any other sensible suggestion, such as a medical condition
Model answer
The baby may be ill, or may not be getting enough food.
Found a mistake?