1.5 Growth and percentile charts
How doctors use percentile charts to monitor the growth of babies and children: what a percentile is, how to read a chart, and why changes across the curves matter.
Monitoring growth
Key terms
- Percentile: a value that shows the percentage of a group that is at or below a measurement. The 25th percentile means 25 out of every 100 are at or below it.
- Percentile chart: a graph with curves that show the range of measurements, such as mass or length, of healthy children of the same age and sex.
- Growth: a permanent increase in size or mass.
Doctors and health visitors measure the mass (weight), length or height, and head size of babies and children at regular times. They compare each measurement with a percentile chart to check that the child is growing as expected.
What is a percentile?
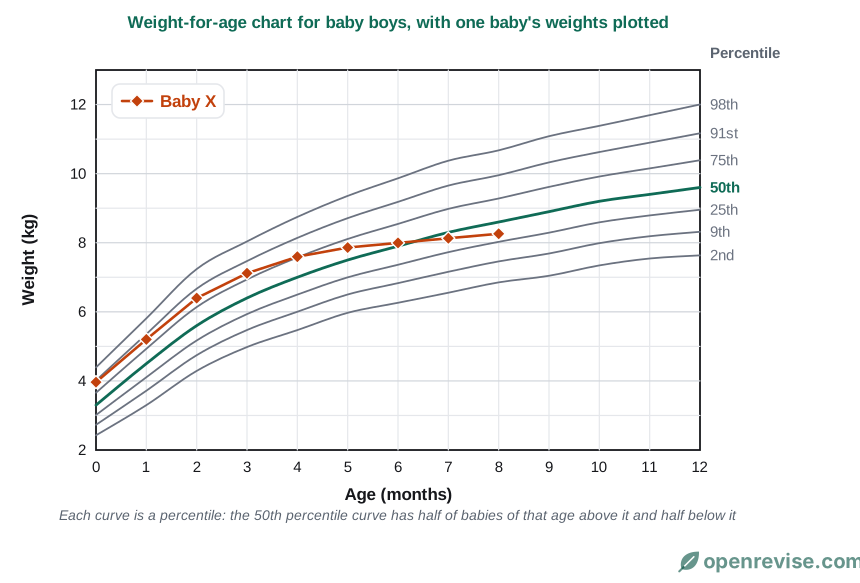
A percentile chart is made by measuring many healthy children. Each curve shows a percentile at each age:
- The 50th percentile is the middle value. Half of children are heavier and half are lighter.
- A baby on the 25th percentile is heavier than 25 out of every 100 babies of the same age and sex, and lighter than the other 75.
- A baby on the 91st percentile is heavier than 91 out of every 100 babies of the same age and sex.
Reading the chart
- Find the baby's age on the horizontal axis.
- Go up to the baby's measurement on the vertical axis, and plot a point.
- See which curve the point is on, or between: that tells you the percentile.
Example. At 4 months, Baby X weighs 7.6 kg. The point is on the 75th percentile curve, so Baby X is heavier than about 75 out of 100 boys of that age. The 50th percentile weight at 4 months is 7.0 kg.
Following growth over time
One measurement is not enough. Doctors look at the pattern as the child grows.
- Most healthy children stay close to the same curve, or between two neighbouring curves, as they get older.
- Baby X was on about the 91st percentile at birth, but by 8 months the baby is between the 25th and 50th percentiles. The weight has crossed several curves, so growth has slowed. A health visitor would check the baby's feeding and look for signs of illness.
- A baby who stays on a low curve, such as the 9th percentile, is not necessarily unhealthy. Some babies are naturally small. What matters is whether growth follows a steady curve.
- A baby whose weight rises quickly across the curves may be gaining weight too fast.
Why percentile charts are useful
- They let a child be compared with other children of the same age and sex.
- Changes in the pattern show up on the chart, so a problem can be spotted early.
- They can be used for mass, length or height, and head size.
Charts show the typical range for a population, so they have limits. Healthy children can differ because of their genes, such as having tall parents, and boys and girls need separate charts.
Test yourself on this lesson
6 exam questions · 12 marks · with mark schemes and model answers
Found a mistake?