5.13 Distance-time graphs
How to read and draw distance-time graphs, finding speed from the gradient, describing stationary and accelerating objects, and using a tangent to find the speed at a point.
Distance-time graphs
Key terms
- Distance-time graph: a graph with time on the horizontal axis and distance (from the start) on the vertical axis.
- Gradient: how steep a line is. It is the change in the vertical value divided by the change in the horizontal value.
- Tangent: a straight line that just touches a curve at one point and has the same gradient as the curve at that point.
A distance-time graph shows how far an object has moved from its starting position over time. The most important rule is:
\text{speed} = \text{gradient of a distance-time graph}
The gradient is calculated by dividing the change in distance by the change in time.
Reading the graph
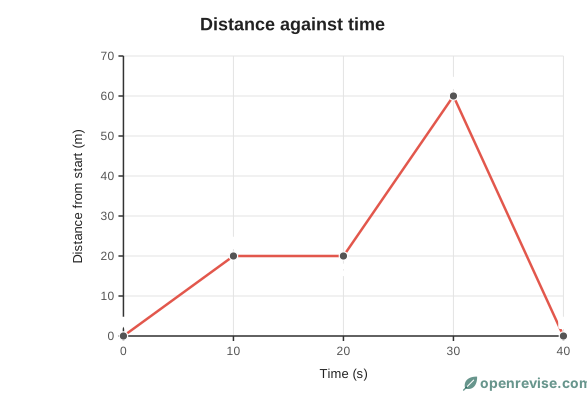
The graph above shows a journey in four stages.
- A to B (0-10 s): a straight sloping line. The distance increases by the same amount each second, so the object moves at a constant speed. The speed is the gradient: \frac{20 \text{ m}}{10 \text{ s}} = 2.0 \text{ m/s}.
- B to C (10-20 s): a horizontal line. The distance does not change, so the object is stationary (speed = 0 m/s).
- C to D (20-30 s): a steeper straight line. The object moves at a larger constant speed: \frac{40 \text{ m}}{10 \text{ s}} = 4.0 \text{ m/s}.
- D to E (30-40 s): a line sloping downwards. The distance from the start is decreasing, so the object is returning to its starting point. The speed is \frac{60 \text{ m}}{10 \text{ s}} = 6.0 \text{ m/s} (the line goes down, so the velocity is in the opposite direction).
Rules for reading distance-time graphs
| Shape of the line | What it means |
|---|---|
| Horizontal line | Stationary (not moving) |
| Straight line sloping up | Constant speed away from the start |
| Steeper straight line | Faster constant speed |
| Line sloping down | Moving back towards the start |
| Curve getting steeper | Speeding up (accelerating) |
| Curve getting less steep | Slowing down (decelerating) |
Calculating speed from the gradient
To find the speed from a graph, pick two points on the straight section of the line, far apart so that the reading is more accurate.
\text{speed} = \frac{\text{change in distance}}{\text{change in time}} = \frac{d_2 - d_1}{t_2 - t_1}
Worked example. On the graph, between 20 s and 30 s the distance goes from 20 m to 60 m.
\text{speed} = \frac{60 - 20}{30 - 20} = \frac{40}{10} = 4.0 \text{ m/s}
Curved lines and tangents (Higher tier)
When an object is accelerating, the distance-time graph is a curve, because the gradient (the speed) is changing all the time. To find the speed at one particular time, you draw a tangent to the curve and calculate its gradient.
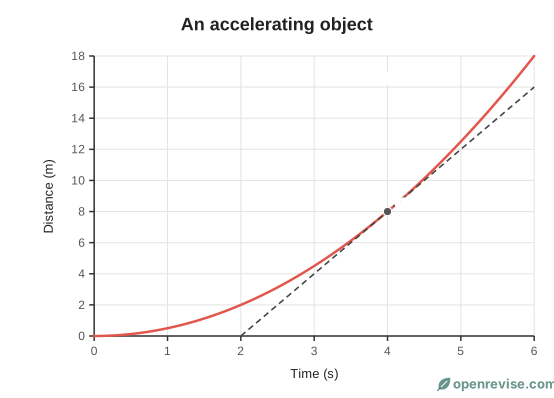
- Choose the time you are interested in, and find the point on the curve.
- Use a ruler to draw a straight line that touches the curve at that point only, and has the same slope as the curve there.
- Pick two points on the tangent far apart, and calculate the gradient.
In the example, the tangent at 4 s passes through (2 s, 0 m) and (6 s, 16 m):
\text{speed at 4 s} = \frac{16 - 0}{6 - 2} = \frac{16}{4} = 4.0 \text{ m/s}
Common mistakes
- A horizontal line on a distance-time graph means the object is stopped. On a velocity-time graph it means constant velocity, which is different. Always look at the axes first.
- A line sloping downwards does not mean "slowing down". It means that the object is getting closer to the start.
- The steepness matters, not the height. A steep line at a low value is a faster object than a shallow line at a high value.
Test yourself on this lesson
9 exam questions · 22 marks · with mark schemes and model answers
Found a mistake?