Maths · Graphs
Viewing as
Teacher view: every answer and mark scheme set out in full.
Real-Life Graphs
Conversion graphs, filling containers and velocity-time graphs: gradient as rate and area as distance.
Learning Objectives
- 1Read and draw conversion graphs, and explain what the gradient and intercept mean in context.
- 2Match container shapes to graphs of depth against time.
- 3Interpret velocity-time graphs: the gradient is acceleration and the area is distance.
- 4Estimate the gradient at a point on a curve and the area under a curve (Higher tier).
Graphs that tell a story
In real-life graphs the axes have units, and the marks come from saying what a gradient, an intercept or an area actually means. A gradient of 1.6 on a graph of kilometres against miles means 1.6 km for every mile. A starting value of £10 on a graph of cost against minutes means a fixed charge of £10. The same skills appear in distance-time graphs, so this lesson extends what you learned there to other situations, especially velocity-time graphs.
A conversion graph
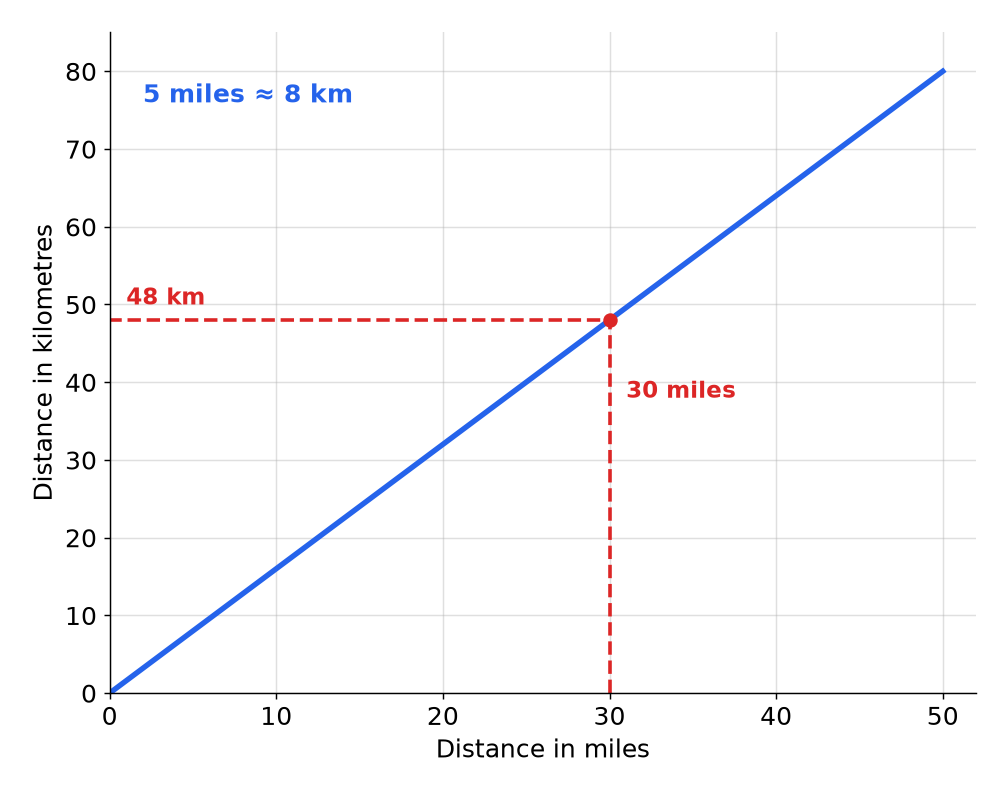
To convert with the graph, go up from the value you know to the line, then across to the other axis. Because the line goes through the origin, the quantities are in direct proportion.
Using a conversion graph
- Reading across From 30 miles go up to the line and across: 48 km.
- Reading the other way To change 40 km to miles, start at 40 on the km axis, go across to the line and down: 25 miles.
- The gradient \(\dfrac{80}{50} = 1.6\), so 1 mile is 1.6 km.
- Straight line through the origin Zero in one unit is zero in the other, and doubling one doubles the other.
Straight lines in real life
When a real-life graph is a straight line, \(y = mx + c\) still works, and \(m\) and \(c\) have meanings.
-
Gradient
The rate of change: cost per minute, speed, pounds per kilogram.
-
Intercept
The starting value when the horizontal quantity is zero: a fixed charge, a starting temperature, or a deposit.
-
Example
A phone plan costs £10 a month plus 5p a minute, so \(C = 0.05m + 10\). It costs £20 for 200 minutes, because \(0.05 \times 200 + 10 = 20\).
-
Units
The gradient has units "per": the units on the \(y\)-axis divided by the units on the \(x\)-axis.
Meaning of a gradient
A taxi company charges a fixed fee of £3 plus £2 for each kilometre. Write down the equation for the cost \(C\) pounds for a journey of \(d\) kilometres, and say what the gradient means.
Show the solutionHide the solution
- 1 Find the rate Each kilometre costs £2, so the gradient is 2.
- 2 Find the fixed amount The £3 is charged even for 0 km, so it is the intercept.
- 3 Write the equation \(C = 2d + 3\).
- 4 Explain The gradient 2 means the cost goes up by £2 for every extra kilometre.
Answer\(C = 2d + 3\); the gradient is the cost per kilometre, £2
Filling containers
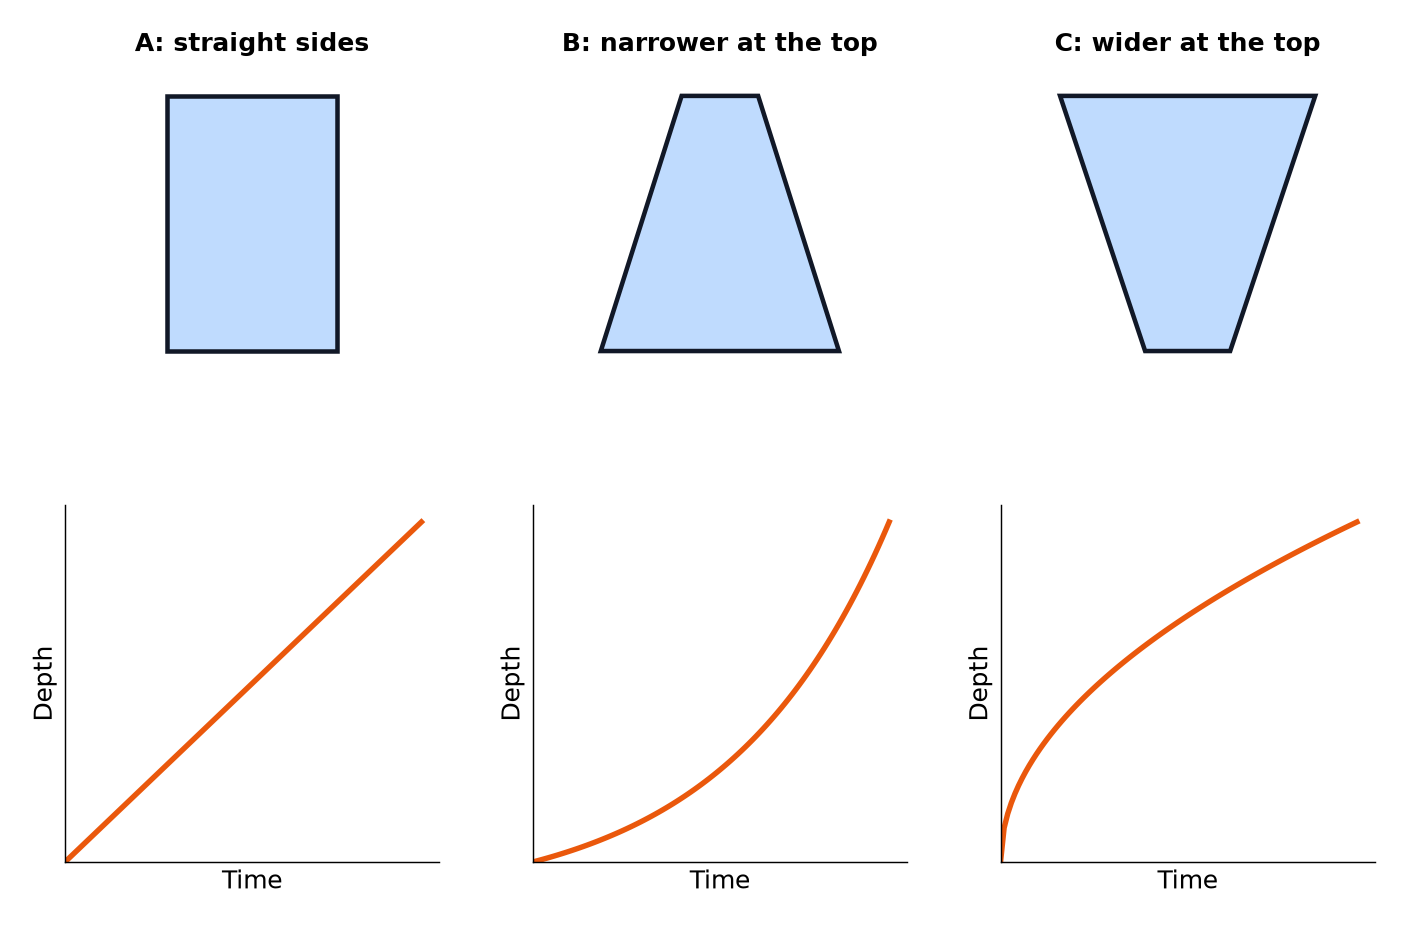
Water goes in at a steady rate. In a narrow part the depth rises quickly, so the graph is steep. In a wide part the depth rises slowly, so the graph is shallow.
Matching shape and graph
- Straight sides The depth rises at a constant rate, so the graph is a straight line.
- Narrower as it goes up The depth rises faster and faster, so the graph gets steeper.
- Wider as it goes up The depth rises more and more slowly, so the graph flattens.
- Gradient The steepness of the graph at any time shows how quickly the depth is rising.
A velocity-time graph
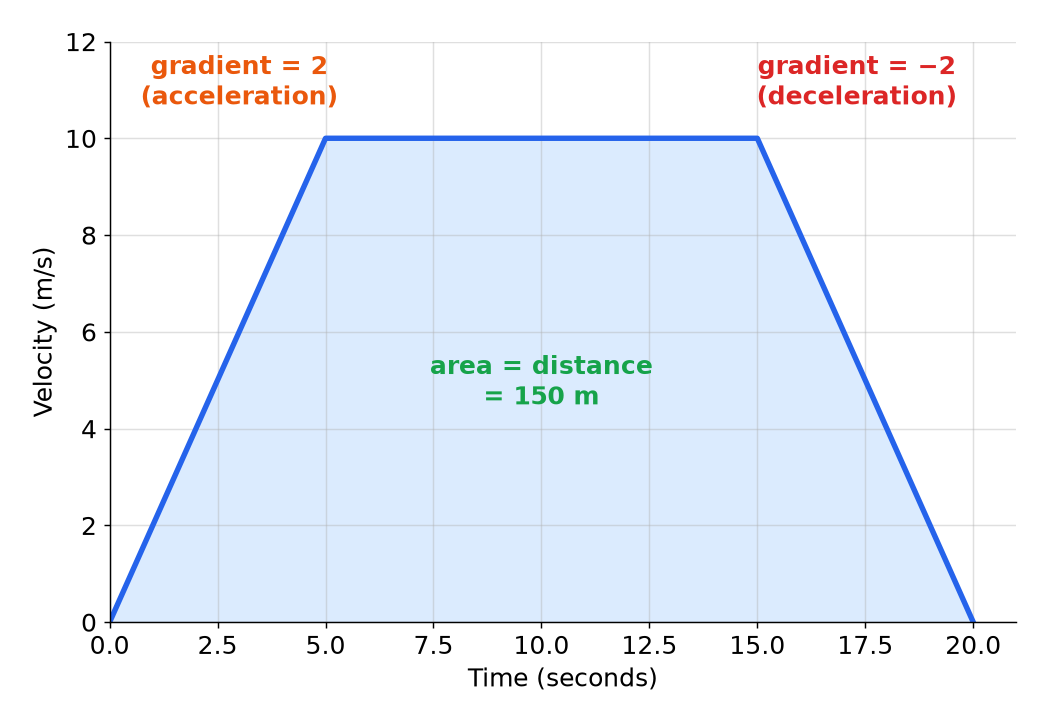
On a velocity-time graph the vertical axis is how fast something is going. The gradient is the acceleration, and the area under the graph is the distance travelled.
Reading a velocity-time graph
- Gradient is acceleration \(\dfrac{10}{5} = 2\) m/s\(^2\) for the first 5 seconds.
- Flat is constant speed A horizontal line means no acceleration.
- Falling is deceleration A negative gradient means slowing down.
- Area is distance Split the shape into triangles and rectangles and add their areas.
Distance from a velocity-time graph
Use the graph above to work out the total distance travelled.
Show the solutionHide the solution
- 1 Split into shapes A triangle for 0 to 5 s, a rectangle for 5 to 15 s, and a triangle for 15 to 20 s.
- 2 First triangle \(\dfrac{1}{2} \times 5 \times 10 = 25\).
- 3 Rectangle \(10 \times 10 = 100\).
- 4 Last triangle and total \(\dfrac{1}{2} \times 5 \times 10 = 25\), so the total is \(25 + 100 + 25 = 150\) m.
Answer150 m
Curves in real life (Higher tier)
When the graph is curved, the steepness is changing, so you estimate it at a point.
-
Gradient at a point
Draw a tangent, a straight line that just touches the curve at the point, and find its gradient with a triangle.
-
Rate of change
On a distance-time graph, the gradient of the tangent is the speed at that instant.
-
Area under a curve
Split the area into trapezia or rectangles and add them to estimate it.
-
Over or under
Say whether the estimate is probably too big or too small, and why.
Test yourself
-
1
What does the gradient of a velocity-time graph show?
Show answerHide answer
The acceleration.
-
2
What does the area under a velocity-time graph show?
Show answerHide answer
The distance travelled.
-
3
What does the intercept mean on a graph of taxi fare against distance?
Show answerHide answer
The fixed starting charge.
-
4
Which container gives a straight-line depth graph?
Show answerHide answer
One with straight vertical sides.
-
5
What is the acceleration when velocity rises from 0 to 12 m/s in 4 seconds?
Show answerHide answer
\(\dfrac{12}{4} = 3\) m/s\(^2\).
Exam technique: real-life graphs
Say what the numbers mean, in words, with units.
-
Include units
Acceleration is in m/s\(^2\), not just a number.
-
Show the area as shapes
Write each triangle or rectangle separately and then add.
-
Read carefully
Use the scale on the axes, and watch for graphs where each square is not 1.
-
Use the context
"The gradient is £2 per km" earns more than "the gradient is 2".
Summary and exam focus
- On a conversion graph, read from one axis to the line and across to the other.
- In a real-life straight line, the gradient is the rate of change and the intercept is the starting value.
- The steeper the depth-time graph, the faster the container fills.
- On a velocity-time graph the gradient is acceleration and the area is distance.
Exam focus
A car speeds up from rest to 20 m/s in 10 seconds. Work out its acceleration. (2 marks) (2 marks)
Acceleration is the change in velocity divided by the time, \(\dfrac{20}{10} = 2\) m/s\(^2\). The units are worth including, and a mark is given for the method \(20 \div 10\) even if the answer is wrong.
Key terms
The words this lesson expects you to use. Each one is linked from the first place it appears above.
- Conversion graph
- A graph for changing between two units, such as miles and kilometres.
- Rate of change
- How quickly one quantity changes compared with another.
- Acceleration
- The rate at which velocity changes, in metres per second per second.
- Deceleration
- A negative acceleration, when something is slowing down.
- Velocity
- Speed in a given direction.
- Velocity-time graph
- A graph of velocity against time, where the gradient is acceleration.
- Fixed charge
- An amount paid whatever the quantity used.
- Tangent
- A straight line that touches a curve at one point.
- Trapezium
- A shape with a pair of parallel sides, used to estimate areas under curves.
Questions and answers
15 questions set on this lesson, with the mark schemes and model answers open.
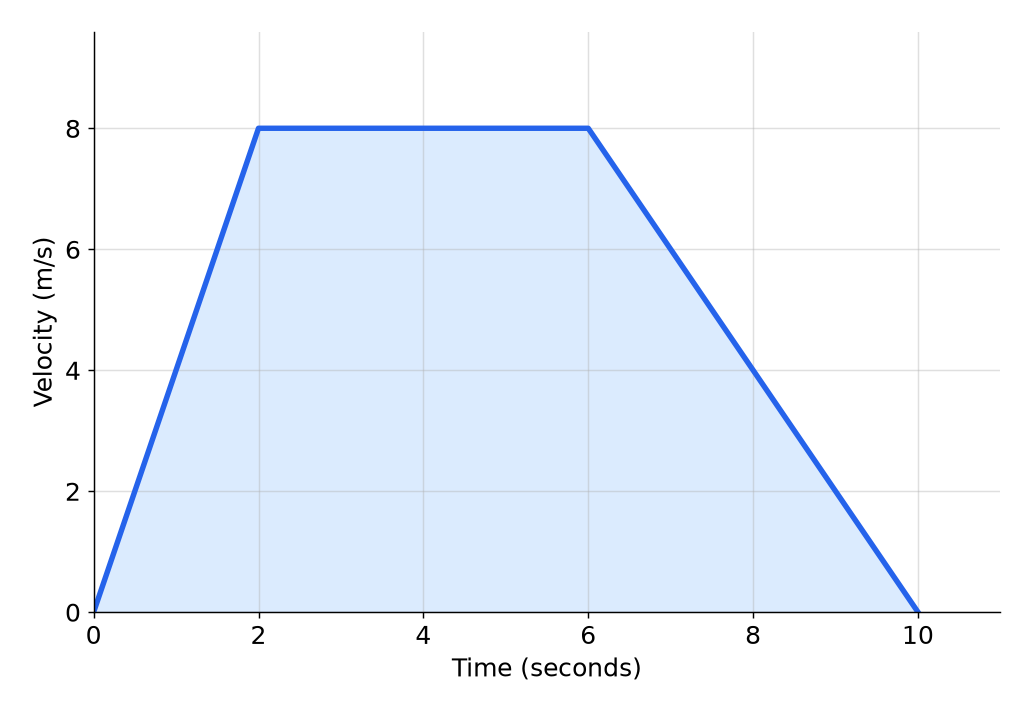
The graph shows the velocity of a car during a 10 second journey. (a) Work out the acceleration of the car in the first 2 seconds. [2 marks] (b) Work out the deceleration of the car in the last 4 seconds. [2 marks] (c) Work out the total distance travelled by the car. [2 marks]
Mark scheme — 6 marks available
- (a) \(\dfrac{8}{2}\) — M1
- (a) 4 m/s\(^2\) — A1
- (b) \(\dfrac{8}{4}\) — M1
- (b) 2 m/s\(^2\) — A1
- (c) \(\dfrac{1}{2}(10 + 4) \times 8\) or the areas of the three parts added — M1
- (c) 56 m — A1
Model answer
(a) \(\dfrac{8}{2} = 4\) m/s\(^2\). (b) \(\dfrac{8}{4} = 2\) m/s\(^2\). (c) The shape is a trapezium with parallel sides 10 and 4 and height 8, so the distance is \(\dfrac{1}{2}(10 + 4) \times 8 = 56\) m.
A mobile phone plan costs \(\pounds 12\) a month plus 4p for each minute of calls. (a) Work out the cost of a month with 150 minutes of calls. [2 marks] (b) Write down what the number 12 would represent on a graph of cost against minutes. [1 mark]
Mark scheme — 3 marks available
- (a) \(150 \times 0.04\) or \(150 \times 4 = 600\) — M1
- (a) \(\pounds 18\) — A1
- (b) The fixed charge, or the cost with no calls — B1
Model answer
(a) \(150 \times 0.04 = 6\), so the cost is \(12 + 6 = \pounds 18\). (b) It is the \(y\)-intercept, the fixed monthly charge.
The temperature \(F\) in degrees Fahrenheit is given by \(F = 1.8C + 32\), where \(C\) is the temperature in degrees Celsius. Work out \(F\) when \(C = 20\).
Mark scheme — 2 marks available
- \(1.8 \times 20\) or 36 seen — M1
- 68 — A1
Model answer
\(F = 1.8 \times 20 + 32 = 36 + 32 = 68\).
A cyclist starts from rest and speeds up steadily to 6 m/s in 3 seconds. She then cycles at 6 m/s for 10 seconds, and then slows down steadily to rest in 3 seconds. (a) Work out her acceleration in the first 3 seconds. [1 mark] (b) Work out the total distance she travels. [3 marks]
Mark scheme — 4 marks available
- (a) 2 m/s\(^2\) — B1
- (b) \(\dfrac{1}{2} \times 3 \times 6\) or \(10 \times 6\) — M1
- (b) \(9 + 60 + 9\) or an equivalent total — M1
- (b) 78 m — A1
Model answer
(a) \(\dfrac{6}{3} = 2\) m/s\(^2\). (b) The two triangles are each \(\dfrac{1}{2} \times 3 \times 6 = 9\) and the rectangle is \(10 \times 6 = 60\), so the total is \(9 + 60 + 9 = 78\) m.
Water is poured at a steady rate into a glass that is wider at the top than at the bottom. Describe the graph of the depth of the water against time.
Mark scheme — 2 marks available
- Starts steep — Q1
- Gets less steep, or flatter, as the glass fills — Q1
Model answer
The depth rises quickly at first, because the bottom is narrow, and then more slowly as the glass gets wider. So the graph starts steep and gets less steep.
The velocity of a car is measured every 2 seconds. At times \(t = 0, 2, 4, 6\) seconds the velocity is \(v = 0, 6, 10, 12\) metres per second. Use trapezia to estimate the distance travelled in the 6 seconds.
Mark scheme — 3 marks available
- One trapezium area found correctly — M1
- \(6 + 16 + 22\) or equivalent — M1
- 44 m — A1
Model answer
The areas of the three trapezia are \(\dfrac{1}{2} \times 2 \times (0 + 6) = 6\), \(\dfrac{1}{2} \times 2 \times (6 + 10) = 16\) and \(\dfrac{1}{2} \times 2 \times (10 + 12) = 22\). The total is \(6 + 16 + 22 = 44\) m.
On a conversion graph, 5 miles is about 8 km. About how many kilometres is 30 miles?
Why: 30 miles is 6 lots of 5 miles, so \(6 \times 8 = 48\) km.
What does the gradient of a velocity-time graph show?
Why: Gradient is change in velocity divided by time, which is acceleration.
What does the area under a velocity-time graph show?
Why: Velocity multiplied by time gives distance.
A car speeds up from 0 to 12 m/s in 4 seconds. What is its acceleration?
Why: \(\dfrac{12}{4} = 3\).
A taxi costs \(\pounds 3\) plus \(\pounds 2\) for each kilometre. What is the cost of a 7 km journey?
Why: \(3 + 2 \times 7 = 17\).
On a graph of taxi cost against distance, what does the \(y\)-intercept mean?
Why: The intercept is the cost for 0 km.
A container gets wider towards the top and is filled at a steady rate. What happens to the depth-time graph?
Why: The wider the container, the more slowly the depth rises.
A velocity-time graph is a triangle that rises from 0 to 8 m/s in 5 seconds. What distance does it show?
Why: Area \(= \dfrac{1}{2} \times 5 \times 8 = 20\).
How can you estimate the speed at one moment from a curved distance-time graph?
Why: The gradient of the tangent is the rate of change at that point.