Maths · Statistics
Viewing as
Teacher view: every answer and mark scheme set out in full.
Histograms and Sampling
Using frequency density to draw and read histograms, and taking random, stratified and capture-recapture samples.
Learning Objectives
- 1Draw and interpret histograms with unequal class widths using frequency density.
- 2Find frequencies from a histogram, and estimate the number of values in part of a class.
- 3Explain the difference between a population and a sample, and why samples can be biased.
- 4Take a stratified sample, and use the capture-recapture method to estimate a population.
When the classes are not equal
In a bar chart the height shows the frequency, but when the classes have different widths that is no longer fair, because a wide class naturally holds more values. A histogram solves this by making the area of each bar show the frequency, so the height shows the frequency density. This lesson also looks at how data is collected, since a conclusion is only as good as the sample behind it. Both topics are Higher tier content, and they are mostly about careful working with a few simple formulae.
Frequency density and histograms
In a histogram the area of a bar is the frequency.
-
The formula
Frequency density \(= \dfrac{\text{frequency}}{\text{class width}}\).
-
Frequency from a bar
Frequency \(=\) frequency density \(\times\) class width, which is the area of the bar.
-
The axes
The vertical axis is labelled frequency density, and there are no gaps between the bars.
-
Why it works
A class twice as wide gets a bar half as high for the same frequency, so the areas stay in proportion.
A histogram
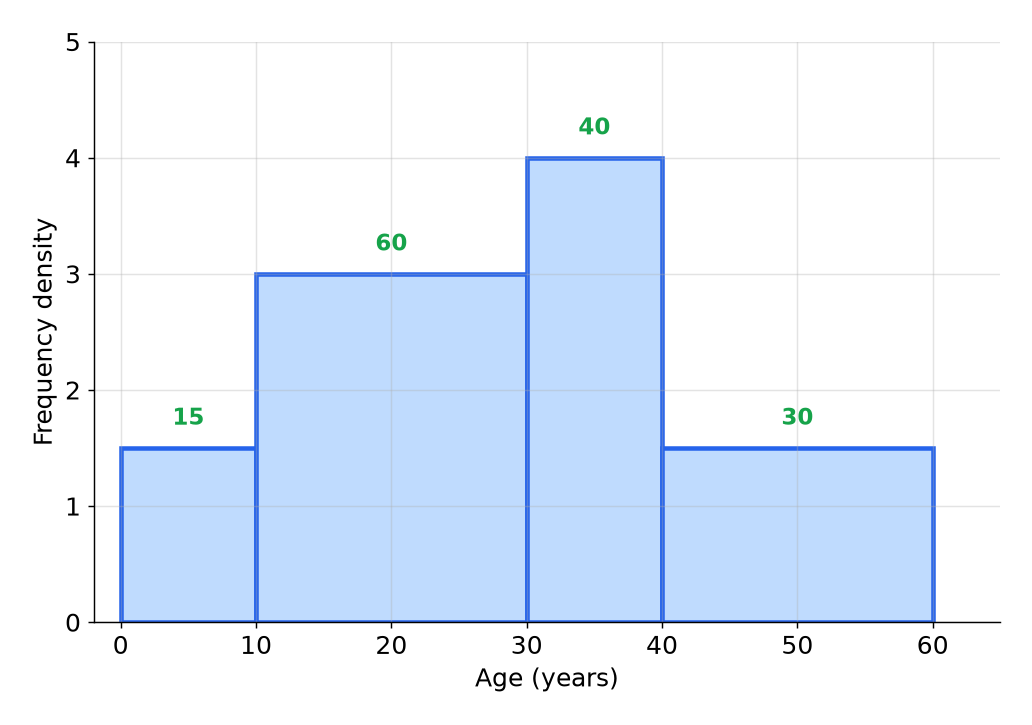
The green numbers are the frequencies. The class from 10 to 30 has width 20 and frequency density 3, so its frequency is \(3 \times 20 = 60\). The bar from 0 to 10 has width 10 and height 1.5, so its frequency is 15.
Reading the histogram
- Total frequency \(15 + 60 + 40 + 30 = 145\).
- Modal class The tallest bar is 30 to 40, with the highest frequency density.
- Part of a class An estimate of the number aged 30 to 35 is half the class, \(0.5 \times 40 = 20\), assuming the values are spread evenly.
- Drawing Work out the frequency density for each class, then draw bars of that height.
Drawing the bars
The table shows the lengths of 60 worms. For the class \(0 < l \leq 5\) the frequency is 10, for \(5 < l \leq 15\) it is 30, and for \(15 < l \leq 20\) it is 20. Work out the frequency density for each class.
Show the solutionHide the solution
- 1 First class The width is 5, so \(\dfrac{10}{5} = 2\).
- 2 Second class The width is 10, so \(\dfrac{30}{10} = 3\).
- 3 Third class The width is 5, so \(\dfrac{20}{5} = 4\).
- 4 Draw Bars of heights 2, 3 and 4 over the three classes, with no gaps.
Answer2, 3 and 4
Populations and samples
The population is everyone or everything you want to know about, and a sample is the part you actually measure.
-
Why sample
Asking everyone is slow or expensive, so a sample is used.
-
Bias
A sample is biased if some members of the population are more likely to be chosen than others, such as asking only people in a gym about exercise.
-
Random sample
Every member has an equal chance of being chosen, for example by using random numbers.
-
Sample size
A larger sample is generally more reliable, but takes more effort.
Stratified sampling
In a stratified sample, each group (stratum) is represented in proportion to its size.
-
The formula
Number in the sample from a group \(= \dfrac{\text{size of the group}}{\text{size of the population}} \times \text{sample size}\).
-
Example
A school has 600 pupils, 240 of them in Year 10. A sample of 50 should include \(\dfrac{240}{600} \times 50 = 20\) pupils from Year 10.
-
Check
The numbers from each group should add up to the sample size.
-
Choose randomly within each group
Each group's sample should still be chosen at random.
Estimating a population (capture-recapture)
To estimate how many animals are in a population, mark some and see how many marked ones turn up later.
-
Method
Capture and mark \(M\) animals, release them, then capture a second sample of \(n\) animals and count the \(m\) that are marked.
-
Assumption
The proportion marked in the second sample matches the proportion in the whole population: \(\dfrac{m}{n} = \dfrac{M}{N}\).
-
Formula
\(N = \dfrac{M \times n}{m}\).
-
Example
50 fish are marked. A second sample of 40 has 8 marked. The population is estimated as \(\dfrac{50 \times 40}{8} = 250\).
Capture-recapture
A scientist catches 30 birds, marks them and releases them. A week later she catches 60 birds, and 9 of them are marked. Estimate the number of birds in the population.
Show the solutionHide the solution
- 1 Use the proportions \(\dfrac{9}{60} = \dfrac{30}{N}\).
- 2 Rearrange \(N = \dfrac{30 \times 60}{9}\).
- 3 Calculate \(\dfrac{1800}{9} = 200\).
- 4 Comment It is an estimate, and it assumes the birds mix evenly and none leave or join.
Answer200
Test yourself
-
1
What is frequency density?
Show answerHide answer
Frequency divided by class width.
-
2
What does the area of a bar in a histogram show?
Show answerHide answer
The frequency.
-
3
What makes a sample biased?
Show answerHide answer
Some members of the population are more likely to be chosen than others.
-
4
How many Year 10 pupils are in a stratified sample of 50 if Year 10 is 240 of 600?
Show answerHide answer
20.
-
5
What is the capture-recapture formula?
Show answerHide answer
\(N = \dfrac{M \times n}{m}\).
Exam technique: histograms and sampling
Show each calculation separately.
-
Label the vertical axis
Frequency density, not frequency.
-
Work out the width of each class
Use the class boundaries, not the number of values.
-
Use the area for estimates
Part of a bar is the same fraction of the frequency.
-
State the assumptions
In capture-recapture, say the population has not changed and the marked animals have mixed in.
Summary and exam focus
- In a histogram, frequency density is frequency divided by class width, and the area of the bar is the frequency.
- A random sample gives every member an equal chance, and a biased sample does not.
- In a stratified sample, each group is represented in proportion to its size.
- Capture-recapture estimates a population as \(N = \dfrac{M \times n}{m}\).
Exam focus
A school has 600 pupils, and 240 of them are in Year 10. A stratified sample of 50 pupils is taken. How many Year 10 pupils should be in the sample? (2 marks) (2 marks)
The fraction of the school in Year 10 is \(\dfrac{240}{600} = \dfrac{2}{5}\), so \(\dfrac{2}{5} \times 50 = 20\) pupils. Show the fraction before multiplying, as it earns the method mark.
Key terms
The words this lesson expects you to use. Each one is linked from the first place it appears above.
- Histogram
- A chart with touching bars where the area of each bar shows the frequency.
- Frequency density
- Frequency divided by class width, used as the height of a histogram bar.
- Class width
- The size of a class, found by subtracting its lower boundary from its upper boundary.
- Population
- The whole group that is being studied.
- Sample
- A part of the population that is selected for study.
- Bias
- A tendency for a sample to favour some outcomes over others.
- Random sample
- A sample where every member of the population has an equal chance of being chosen.
- Stratified sample
- A sample where each group is represented in proportion to its size.
- Capture-recapture
- A method of estimating the size of a population by marking and recapturing members.
Questions and answers
15 questions set on this lesson, with the mark schemes and model answers open.
The table shows the lengths of some worms. For the class \(0 < l \leq 2\) the frequency is 6, for \(2 < l \leq 8\) it is 18, and for \(8 < l \leq 20\) it is 24. Work out the frequency density for each class. [3 marks]
Mark scheme — 3 marks available
- Class widths 2, 6 and 12 used — M1
- At least two frequency densities correct — A1
- 3, 3 and 2 — A1
Model answer
The widths are 2, 6 and 12. The frequency densities are \(\dfrac{6}{2} = 3\), \(\dfrac{18}{6} = 3\) and \(\dfrac{24}{12} = 2\).
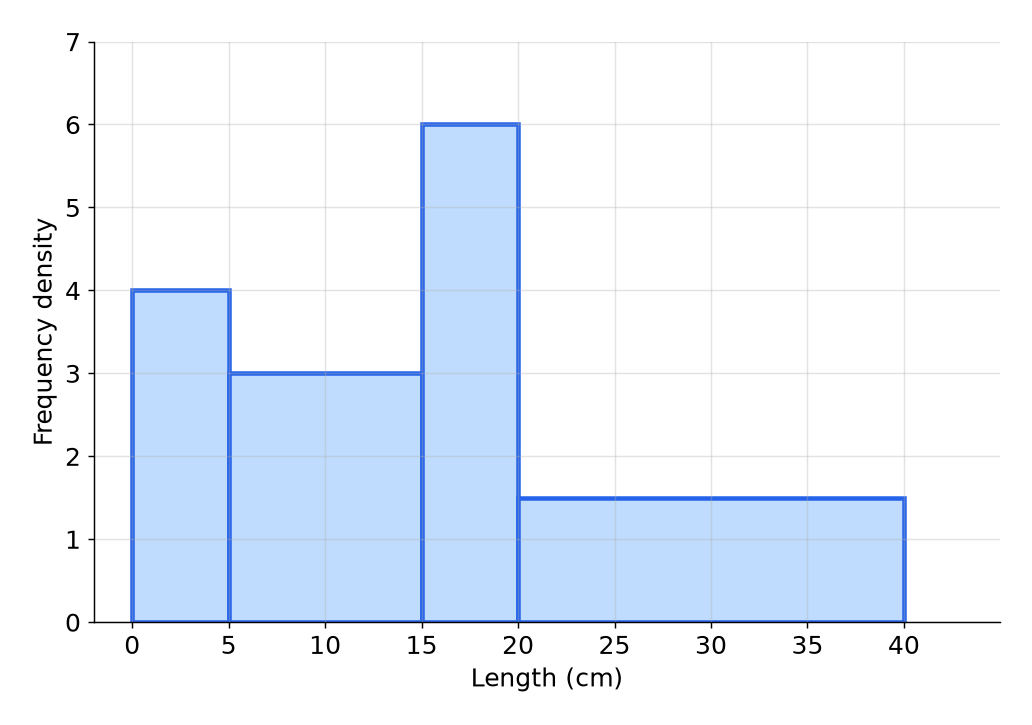
The histogram shows the lengths, in centimetres, of some worms. (a) Work out the number of worms with a length more than 15 cm and up to 20 cm. [2 marks] (b) Work out the number of worms with a length of more than 15 cm. [2 marks]
Mark scheme — 4 marks available
- (a) \(6 \times 5\) — M1
- (a) 30 — A1
- (b) \(1.5 \times 20 = 30\) — M1
- (b) 60 — A1
Model answer
(a) The frequency is the area of the bar: \(6 \times 5 = 30\). (b) The bar from 20 to 40 has a frequency of \(1.5 \times 20 = 30\), so the total is \(30 + 30 = 60\).
On a histogram the bar for the class \(5 < l \leq 15\) has a frequency density of 3. Work out an estimate for the number of values in the class \(5 < l \leq 8\). [2 marks]
Mark scheme — 2 marks available
- \(3 \times 3\) — M1
- 9 — A1
Model answer
The width of \(5 < l \leq 8\) is 3, so the estimate is \(3 \times 3 = 9\).
A company has 120 staff in Sales, 80 staff in Admin and 40 staff in IT. A stratified sample of 30 staff is taken. Work out the number of staff from each department in the sample. [3 marks]
Mark scheme — 3 marks available
- \(\dfrac{120}{240} \times 30\) or the total 240 seen — M1
- At least two numbers correct — A1
- 15, 10 and 5 — A1
Model answer
There are 240 staff. Sales: \(\dfrac{120}{240} \times 30 = 15\). Admin: \(\dfrac{80}{240} \times 30 = 10\). IT: \(\dfrac{40}{240} \times 30 = 5\).
In a lake, 40 fish are caught, marked and returned. Later, a sample of 90 fish is caught, and 12 of them are marked. (a) Work out an estimate for the number of fish in the lake. [2 marks] (b) State one assumption you have made. [1 mark]
Mark scheme — 3 marks available
- (a) \(\dfrac{40 \times 90}{12}\) — M1
- (a) 300 — A1
- (b) The marked fish have mixed evenly, or the population has not changed — B1
Model answer
(a) \(\dfrac{12}{90} = \dfrac{40}{N}\), so \(N = \dfrac{40 \times 90}{12} = 300\). (b) The marked fish have mixed evenly with the others, and none have joined or left the lake.
Beth wants the views of residents about a new park. She asks 30 people as they leave a sports centre. (a) Give one reason why her sample may be biased. [1 mark] (b) Describe how she could improve her sampling. [1 mark]
Mark scheme — 2 marks available
- (a) The sample is not representative of all the residents — B1
- (b) A random sample from all the residents — B1
Model answer
(a) People at a sports centre are more likely to want a park, so they do not represent all the residents. (b) Choose people from all the residents at random, for example from the electoral roll using random numbers.
What is the formula for frequency density?
Why: Frequency density \(= \dfrac{\text{frequency}}{\text{class width}}\).
What does the area of a bar in a histogram show?
Why: Area \(=\) frequency density \(\times\) class width \(=\) frequency.
A histogram bar has class width 20 and frequency density 3. What is the frequency?
Why: \(3 \times 20 = 60\).
A class of width 10 has frequency 30. What is its frequency density?
Why: \(\dfrac{30}{10} = 3\).
A survey about exercise only asks people leaving a gym. What is wrong with the sample?
Why: People at a gym are not typical of the whole population.
A school has 600 pupils, 240 in Year 10. A stratified sample of 50 is taken. How many Year 10 pupils are in the sample?
Why: \(\dfrac{240}{600} \times 50 = 20\).
50 fish are marked and released. A second sample of 40 fish contains 8 marked fish. What is the estimate of the population?
Why: \(\dfrac{50 \times 40}{8} = 250\).
A histogram bar from 30 to 40 has frequency 40. Estimate the number of values from 30 to 35.
Why: 35 is halfway through the class, so about half the frequency: 20.
Why does a larger sample usually give a better estimate?
Why: Bigger samples are less affected by chance.