Viewing as
Teaching this? The teacher view adds 2 files, the mark schemes and the model answers.
Maths · Interpreting and representing data
Line of best fit
When a scatter graph shows correlation, a single straight line through the middle of the points sums up the relationship - and lets you estimate values you never measured, as long as you do not stray too far from the data.
Last Lesson
Answer each one, then check.
-
1
What does positive correlation mean?
Show answerHide answer
As one value increases, the other increases.
-
2
What is an outlier?
Show answerHide answer
A value that does not fit the pattern.
-
3
Does correlation prove that one thing causes another?
Show answerHide answer
No
-
4
Which correlation: temperature and hot drinks sold?
Show answerHide answer
Negative
Learning Objectives
- 1Draw a line of best fit on a scatter graph.
- 2Use a line of best fit to estimate values (interpolation).
- 3Explain why extrapolation can be unreliable.
- 4Decide how reliable an estimate is.
- 5Deal with outliers when drawing a line of best fit.
Drawing a Line of Best Fit
A line of best fit is a single straight line that follows the trend of the points.
-
Straight, with a ruler
One straight line - not a curve, and not dot to dot.
-
Through the middle
About the same number of points on each side, following the slope of the pattern.
-
Ignore outliers
An outlier would pull the line away from the rest.
-
Not always from 0
The line does not have to go through the origin.
-
Only with correlation
If there is no correlation, there is no line of best fit.
A Line of Best Fit in Use
To estimate a value, go from the known value to the line of best fit, then across to the other axis. Here, a car 4.5 years old is estimated to be worth about £6700. The estimate is reasonable because 4.5 years is inside the range of the data.
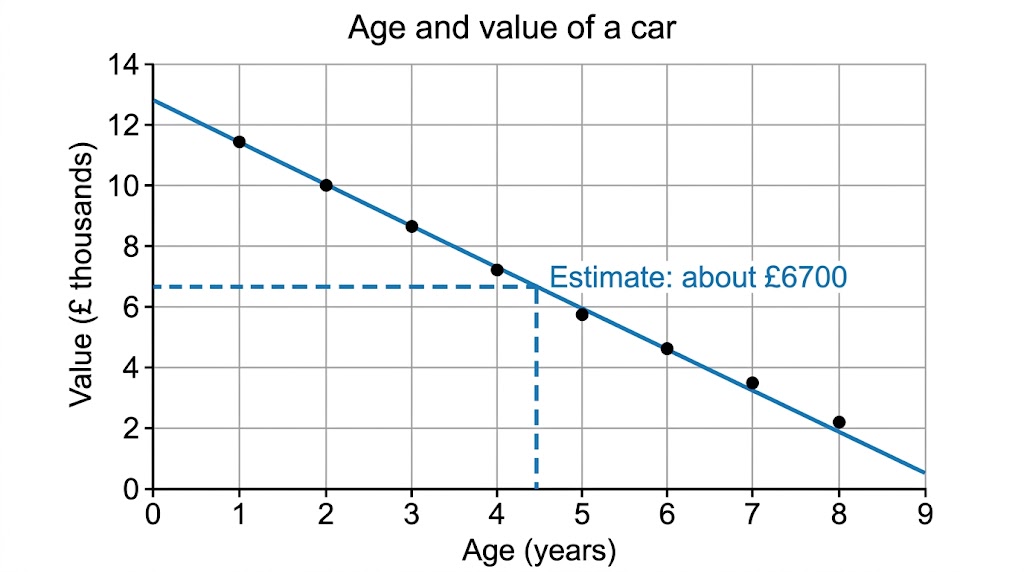
Up from 4.5 years, across to about £6700.
Interpolation and Extrapolation
Interpolation - inside the data
- Estimating within the range of values you have.
- A 4.5-year-old car, when the data covers 1 to 8 years.
- Usually reliable, if the correlation is strong.
Extrapolation - outside the data
- Estimating beyond the range of values you have.
- A 15-year-old car, when the data stops at 8 years.
- Unreliable: the pattern may not continue - the line would say the car is worth less than nothing.
Using a Line of Best Fit
Use the car graph to estimate (a) the value of a car that is 4.5 years old, and (b) the age of a car worth £9000.
Show the solutionHide the solution
- 1 (a) Go up from 4.5 on the age axis to the line then across to the value axis
- 2 Read the value about 6.7 (£ thousands)
- 3 (b) Go across from 9 on the value axis to the line then down to the age axis
- 4 Read the age about 2.8 years
Answer(a) About £6700 (b) About 2.8 years (accept answers close to these)
How Reliable Is the Estimate?
An estimate from a line of best fit is only as good as the data behind it.
-
Strong correlation
Points close to the line give more reliable estimates.
-
Inside the data
Interpolation is more reliable than extrapolation.
-
Enough data
Estimates from 30 points are more reliable than from 5.
-
Sensible values
A line might predict a negative price or a test score over 100 - a sign it has gone too far.
Plot, Fit, Estimate
Ten students recorded their arm span and height, in cm: (150, 152), (155, 154), (158, 160), (162, 161), (165, 167), (168, 166), (171, 172), (175, 174), (178, 180), (182, 181). Plot a scatter graph, draw a line of best fit, estimate the height of a student with an arm span of 173 cm, and explain whether you could use the graph for an adult with an arm span of 200 cm.
1. Choose sensible scales and label the axes.
2. Plot the points and draw the line.
3. Estimate, and comment on reliability.
A good answer shows: Strong positive correlation; the line is close to height = arm span. Estimate for 173 cm: about 173 cm. An arm span of 200 cm is outside the data (extrapolation), so the estimate would be less reliable.
Can I...?
- 1Draw a line of best fit.
- 2Leave out outliers when drawing it.
- 3Estimate a y-value from an x-value.
- 4Estimate an x-value from a y-value.
- 5Explain interpolation.
- 6Explain extrapolation.
- 7Say why an estimate might be unreliable.
- 8Spot an estimate that makes no sense.
Summary & Exam Focus
- One straight line through the middle of the points, ignoring outliers.
- Up (or across) to the line, then across (or down) to read the estimate.
- Interpolation is inside the data and usually reliable; extrapolation is outside it and often not.
- Stronger correlation and more data give more reliable estimates.
Exam focus
Explain why it may not be sensible to use the line of best fit to estimate the score of a student who revised for 20 hours. (1 mark) (1 marks)
When asked to estimate from a graph, draw the lines you use on the graph. An answer in the accepted range earns the marks, and the lines show the examiner your method.
Key terms
The vocabulary this lesson expects you to use. Each one is linked from the first place it appears above.
- Line of best fit
- A straight line drawn through the middle of the points on a scatter graph, following the trend.
- Interpolation
- Estimating a value inside the range of the data.
- Extrapolation
- Estimating a value outside the range of the data.
- Reliable
- Likely to be accurate.
- Outlier
- A point that does not fit the pattern, ignored when drawing the line.
Practice questions
Have a go at each one before you open its answer.
-
Question 1 Calculator 5 marks
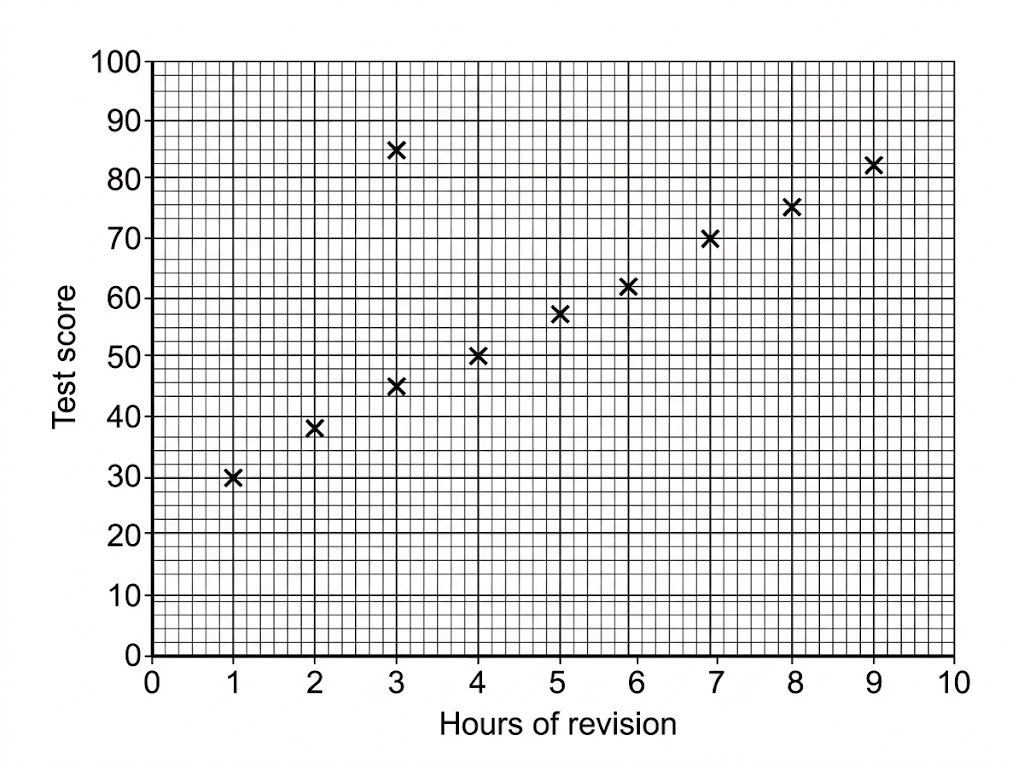
The scatter graph shows the number of hours ten students revised and their test scores. (a) One point is an outlier. Write down its coordinates. (b) Draw a line of best fit on the graph. (c) Use your line to estimate the score of a student who revised for 5.5 hours. (d) Explain why it may not be sensible to use your line to estimate the score of a student who revised for 20 hours.
Show answerHide answer
Model answer
(a) \((3, 85)\). (b) A straight line through the middle of the other nine points. (c) About 60 (accept 57 to 63). (d) 20 hours is far outside the range of the data (extrapolation), and the line would predict a score above 100, which is impossible.
Mark scheme
- (a) \((3, 85)\) — B1
- (b) A single straight line within the band of the points, ignoring the outlier — B1
- (c) Reading from their line at 5.5 hours — M1
- (c) An answer in the range 57 to 63 — A1
- (d) A reason such as outside the range of the data, or the score cannot exceed 100 — C1
-
Question 2 Calculator 1 mark
What is the difference between interpolation and extrapolation?
Show answerHide answer
Model answer
Interpolation is estimating a value inside the range of the data; extrapolation is estimating a value outside the range of the data.
Mark scheme
- Both described correctly — B1
Quick check
-
A line of best fit should be...
Show answerHide answer
C: A straight line through the middle of the points
A single straight line through the middle of the points, following the trend.
-
Estimating a value outside the range of the data is called...
Show answerHide answer
A: Extrapolation
Extrapolation goes beyond the data; interpolation stays inside it.
-
Which estimate from a line of best fit is likely to be MOST reliable?
Show answerHide answer
D: One inside the data, with strong correlation
Estimates inside the data, where the correlation is strong, are the most reliable.
Downloads
Free to keep, print and annotate.
- Line of best fit.pptx Built from the lesson script on 29 September 2026. View
- Line of best fit - Completed Notes.docx The full notes for the lesson, to revise from. Built from the lesson script on 29 September 2026. View
- Line of best fit - Exam Questions.docx Built from the lesson script on 29 September 2026. View
Something here looks wrong?
Tell us what and we will go and look. It goes to whoever writes these pages, nobody else, and we do not ask who you are — so there is nothing to sign and nothing comes back to you.