Viewing as
Teacher view: planning notes, the answers to every question, and the teacher copies of the files.
Maths · Further statistics
Box plots
Find the five-number summary, draw box plots, and compare two distributions using the median and interquartile range.
Teacher resources
The teacher copies: slides with the questions built in, the answers, and anything else attached to this lesson for whoever is teaching it.
- Box plots - Teacher Slides.pptx Teacher The lesson slides with the teacher's notes on each slide, and every question and mark scheme built in. Built from the lesson script on 30 September 2026. View
- Box plots - Teacher Notes.docx Teacher The complete notes with the teacher's notes and every model answer in full. Built from the lesson script on 30 September 2026. View
Student handouts
The same files the students see, to print or hand out.
Warm-up
Answer each one, then check.
-
1
What is the median of 3, 5, 9, 12, 20?
Show answerHide answer
\(9\)
-
2
What is the range of 3, 5, 9, 12, 20?
Show answerHide answer
\(17\)
-
3
What is the interquartile range?
Show answerHide answer
Upper quartile minus lower quartile
-
4
What is a quartile?
Show answerHide answer
A value a quarter or three quarters of the way through the data
-
5
Which measure of average is the middle value?
Show answerHide answer
Median
Learning Objectives
- 1Find the minimum, lower quartile, median, upper quartile and maximum.
- 2Draw a box plot.
- 3Read a box plot.
- 4Compare two data sets using a box plot.
BOX PLOT
A box plot shows the five-number summary: minimum, lower quartile, median, upper quartile, maximum.
The box shows the middle half of the data. The whiskers go out to the smallest and largest values.
Anatomy of a Box Plot
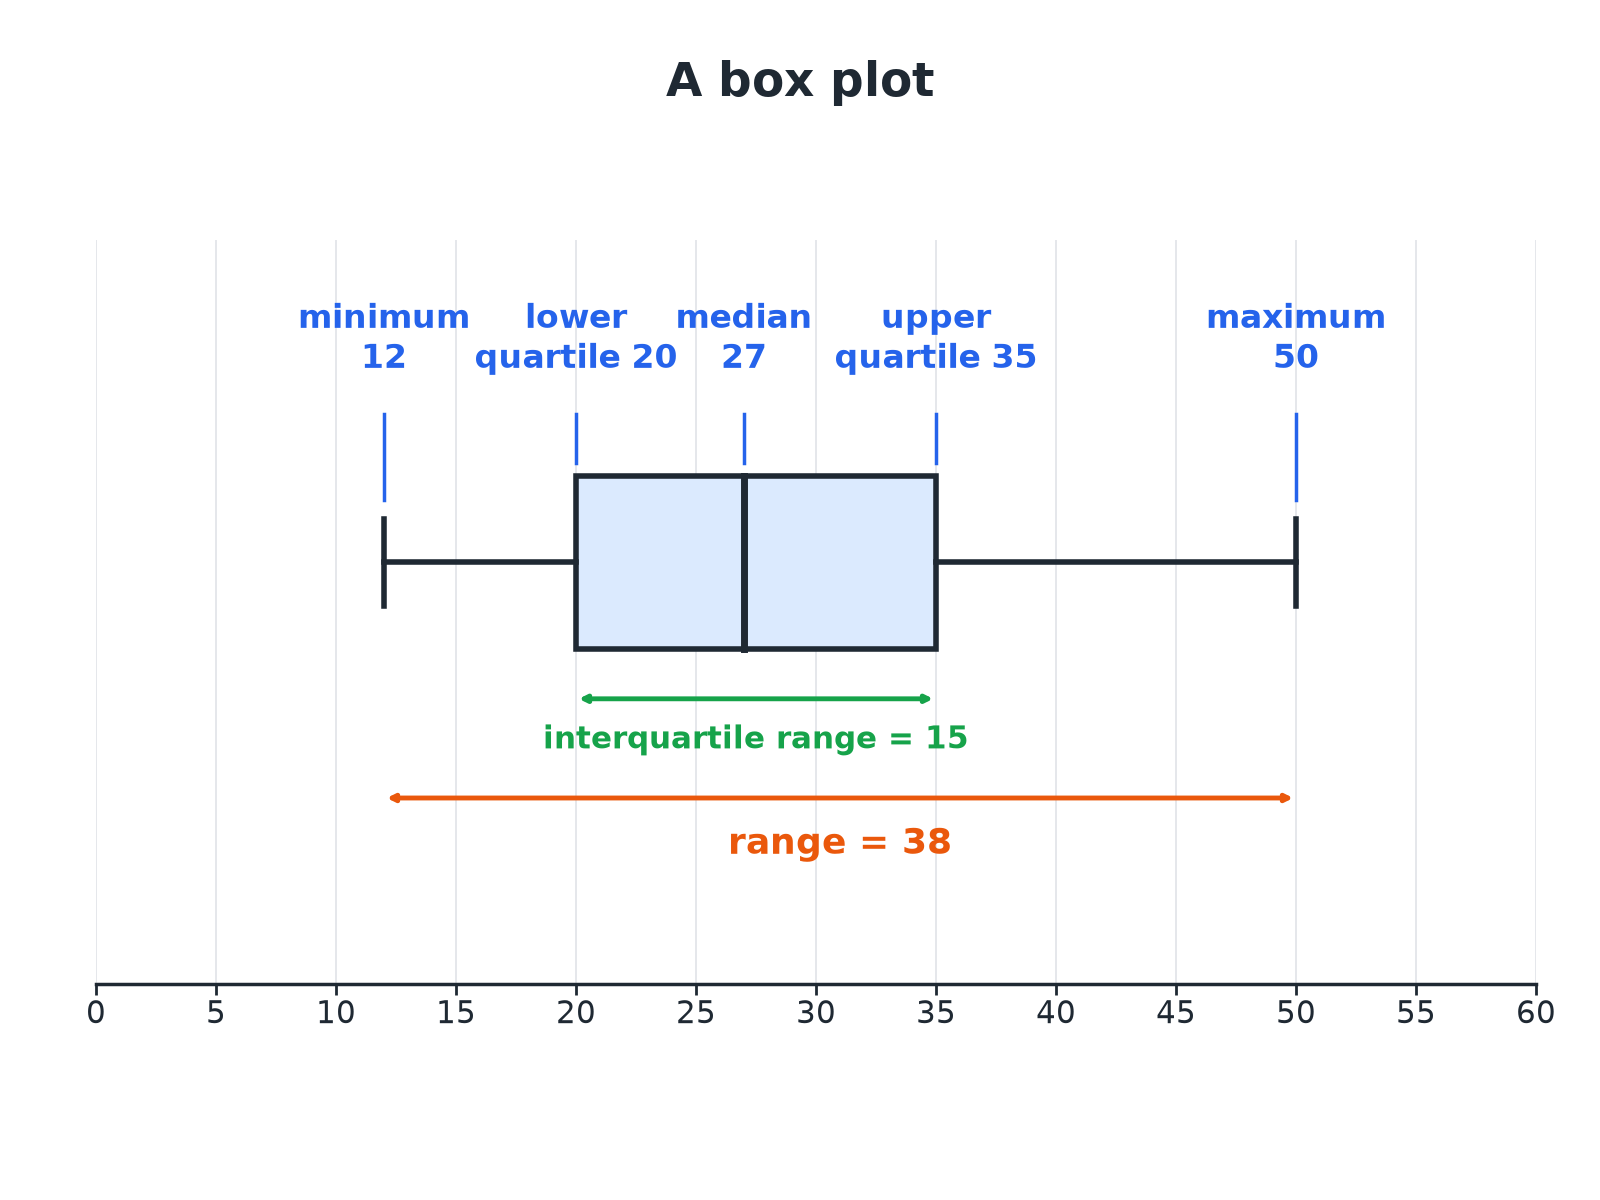
Half of the data lie in the box.
Five-Number Summary
Find the five-number summary of 5, 8, 10, 12, 13, 15, 19, 22, 26.
Show the solutionHide the solution
- 1 Minimum and maximum \(5\) and \(26\)
- 2 Median \(13\) (the 5th of 9 values)
- 3 Lower quartile Middle of \(5, 8, 10, 12\): \(9\)
- 4 Upper quartile Middle of \(15, 19, 22, 26\): \(20.5\)
AnswerMin 5, LQ 9, median 13, UQ 20.5, max 26.
Positions in Ordered Data
For \(n\) values in order.
-
Median
Position: \(\tfrac{n + 1}{2}\)th value
-
Lower quartile
Position: \(\tfrac{n + 1}{4}\)th value
-
Upper quartile
Position: \(\tfrac{3(n + 1)}{4}\)th value
-
Interquartile range
Position: UQ \(-\) LQ
Comparing Two Box Plots
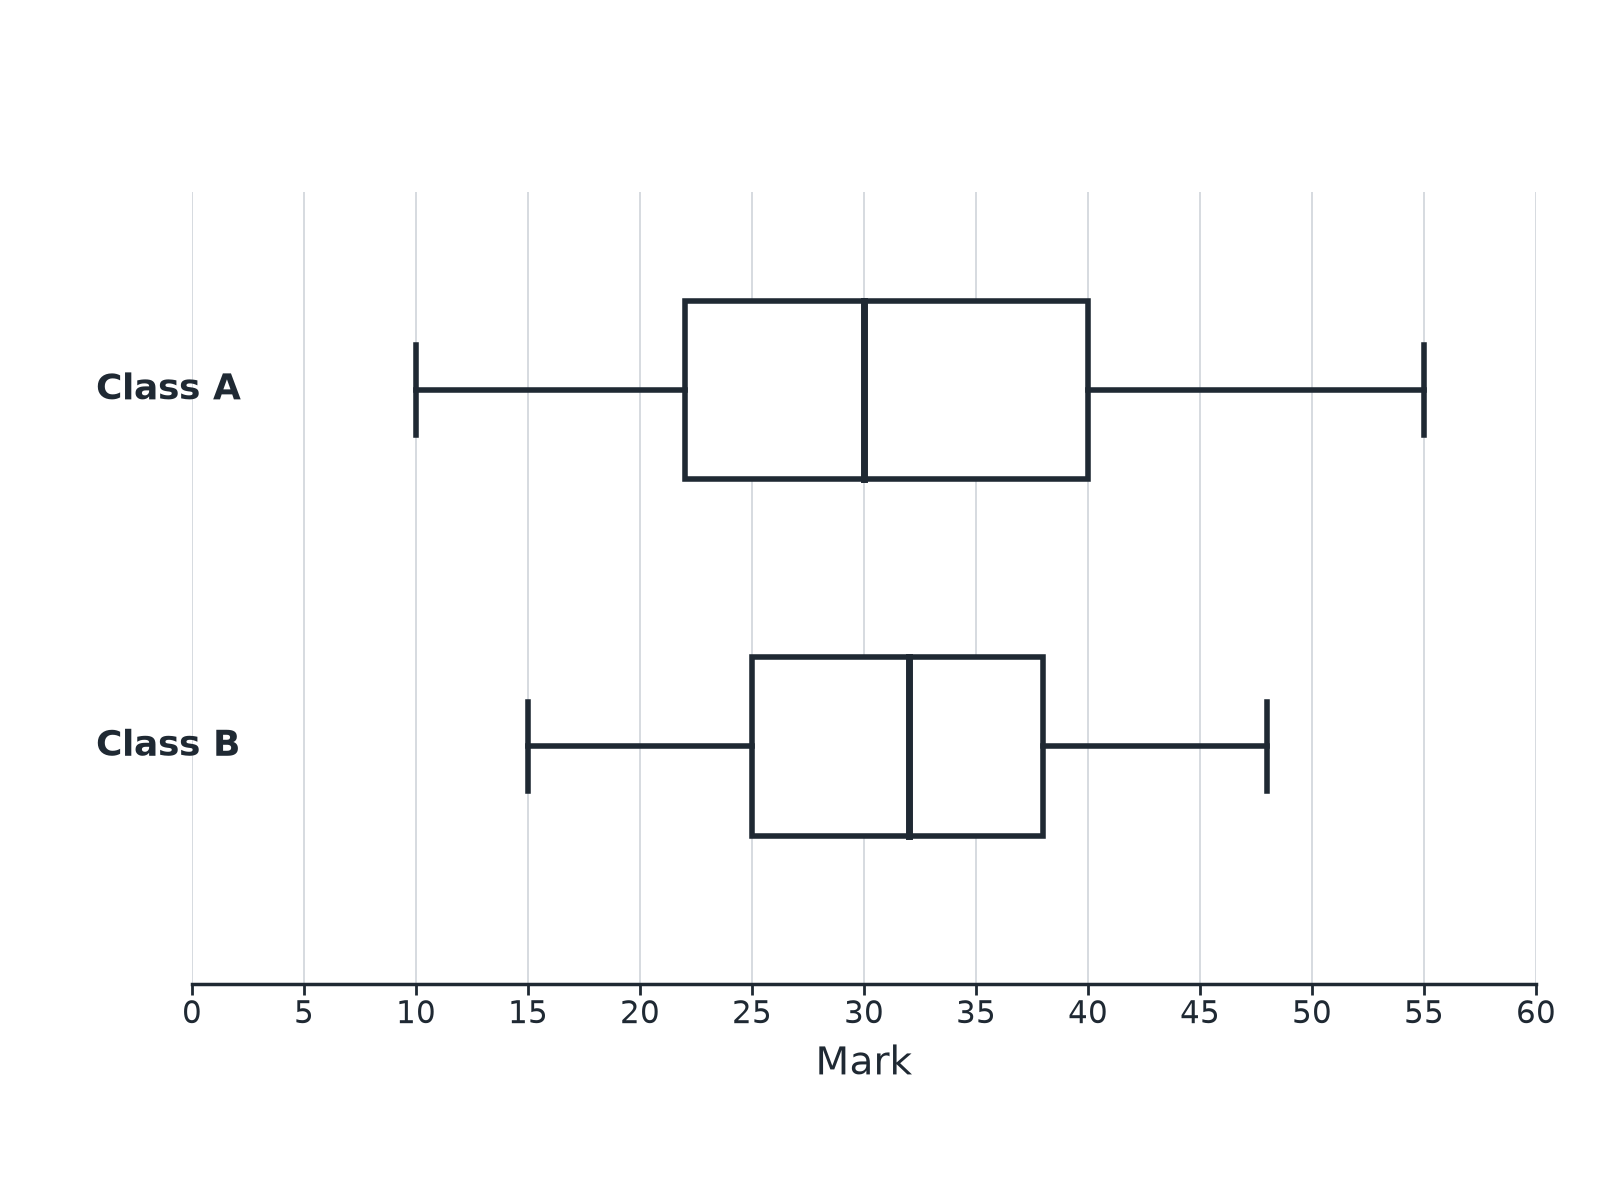
Class A: min 10, LQ 22, median 30, UQ 40, max 55. Class B: min 15, LQ 25, median 32, UQ 38, max 48. Compare the two classes.
Show the solutionHide the solution
- 1 Averages Median of B (32) is higher than A (30)
- 2 Spread: IQR A: \(40 - 22 = 18\); B: \(38 - 25 = 13\)
- 3 Range A: \(45\); B: \(33\)
- 4 Conclusion B has a slightly higher median and is more consistent
AnswerOn average class B did slightly better (median 32 against 30), and B's marks were more consistent (IQR 13 against 18).
Writing a Comparison
Always compare one average and one spread, in context.
-
An average
Compare the medians.
-
A spread
Compare the IQRs (or the ranges).
-
Use the context
"Class B scored higher on average" rather than "B is higher".
-
Use numbers
Quote the values you compared.
Read the Box
A box plot has minimum 4, LQ 10, median 15, UQ 22 and maximum 30. (a) Write down the range. (b) Write down the IQR. (c) The data set has 40 values. Roughly how many are between 10 and 22?
1. Read the five values.
2. Half of the data lie in the box.
A good answer shows: (a) \(30 - 4 = 26\). (b) \(22 - 10 = 12\). (c) About 20, because half of the data are in the box.
Can I...?
- 1Order the data.
- 2Find the median.
- 3Find the quartiles.
- 4Write the five-number summary.
- 5Draw a box plot.
- 6Find the range and IQR.
- 7Compare averages.
- 8Compare spreads.
Summary & Exam Focus
- Five values: min, LQ, median, UQ, max.
- The box holds the middle 50%.
- Compare medians (average) and IQRs (spread).
- Give the numbers you use.
Exam focus
The box plots show the marks of two classes. Compare the distributions. (4 marks) (4 marks)
Compare one average and one spread, and refer to the context.
Key terms
The vocabulary this lesson expects you to use. Each one is linked from the first place it appears above.
- Box plot
- A diagram showing the five-number summary.
- Five-number summary
- Minimum, LQ, median, UQ, maximum.
- Whisker
- The line from the box out to the minimum or maximum.
- Interquartile range
- The width of the box.
- Range
- Maximum minus minimum.
- Consistent
- Less spread out.
Questions and answers
12 questions set on this lesson, with the mark schemes and model answers open.
The box plots show the marks of the students in Class A and in Class B in a test. Compare the distributions of the marks.
Mark scheme — 4 marks available
- Compares medians with values — M1
- Conclusion about average in context — A1
- Compares IQR or range with values — M1
- Conclusion about spread in context — A1
Model answer
The median for B (32) is higher than for A (30), so B did slightly better on average. The IQR for B (13) is less than for A (18), so B's marks were more consistent.
Here are nine numbers: 5, 8, 10, 12, 13, 15, 19, 22, 26. Work out the median and the interquartile range.
Mark scheme — 3 marks available
- Median 13 — B1
- LQ 9 and UQ 20.5 — M1
- 11.5 — A1
Model answer
Median \(= 13\). LQ \(= 9\), UQ \(= 20.5\), IQR \(= 20.5 - 9 = 11.5\).
The five-number summary of some data is: minimum 12, lower quartile 20, median 27, upper quartile 35, maximum 50. Describe how to draw the box plot.
Mark scheme — 3 marks available
- Box from 20 to 35 — B1
- Median line at 27 — B1
- Whiskers to 12 and 50 — B1
Model answer
Draw a number line. Draw a box from 20 to 35 with a line inside at 27. Draw whiskers from the box to 12 and to 50.
A box plot has minimum 12, lower quartile 20, median 27, upper quartile 35 and maximum 50. Work out the range and the interquartile range.
Mark scheme — 2 marks available
- 38 — B1
- 15 — B1
Model answer
Range \(= 50 - 12 = 38\); IQR \(= 35 - 20 = 15\).
The box plot for 60 people has a median of 40. How many of the 60 people have a value greater than 40?
Mark scheme — 2 marks available
- 30 — B1
- Median splits the data in half — C1
Model answer
30, because the median splits the data in half.
Give one reason why the interquartile range is a better measure of spread than the range.
Mark scheme — 2 marks available
- Range affected by extremes — M1
- IQR uses only the middle half — A1
Model answer
The range depends on the extreme values, so one unusual value changes it. The interquartile range is not affected by extreme values.
The box in a box plot shows the...
Why: The middle 50% of the data, from LQ to UQ.
How many values are in the five-number summary?
Why: Minimum, LQ, median, UQ and maximum.
The median of 3, 5, 9, 12, 20 is...
Why: The middle value.
A box plot has LQ 12 and UQ 30. The IQR is...
Why: \(30 - 12 = 18\).
The smaller the IQR, the ...
Why: More consistent the data.
A box plot shows 40 values. About how many are below the median?
Why: Half of them: 20.