Viewing as
Teacher view: planning notes, the answers to every question, and the teacher copies of the files.
Maths · Further statistics
Drawing histograms
Calculate frequency density for grouped data with unequal class widths and draw a histogram.
Teacher resources
The teacher copies: slides with the questions built in, the answers, and anything else attached to this lesson for whoever is teaching it.
- Drawing histograms - Teacher Slides.pptx Teacher The lesson slides with the teacher's notes on each slide, and every question and mark scheme built in. Built from the lesson script on 30 September 2026. View
- Drawing histograms - Teacher Notes.docx Teacher The complete notes with the teacher's notes and every model answer in full. Built from the lesson script on 30 September 2026. View
Student handouts
The same files the students see, to print or hand out.
- Drawing histograms.pptx Built from the lesson script on 30 September 2026. View
- Drawing histograms - Completed Notes.docx The full notes for the lesson, to revise from. Built from the lesson script on 30 September 2026. View
- Drawing histograms - Exam Questions.docx Built from the lesson script on 30 September 2026. View
Warm-up
Answer each one, then check.
-
1
What is the width of the class \(10 < t \le 30\)?
Show answerHide answer
\(20\)
-
2
Work out \(30 \div 20\).
Show answerHide answer
\(1.5\)
-
3
What is a frequency table?
Show answerHide answer
A table of how often values occur
- 4
-
5
Write \(12 \div 10\) as a decimal.
Show answerHide answer
\(1.2\)
Learning Objectives
- 1Explain why a histogram uses frequency density.
- 2Work out the frequency density for each class.
- 3Draw a histogram with unequal class widths.
- 4Label the axes correctly.
HISTOGRAM
In a histogram the area of each bar shows the frequency. The height is the frequency density.
\(\text{frequency density} = \dfrac{\text{frequency}}{\text{class width}}\). The bars touch and there are no gaps.
A Histogram
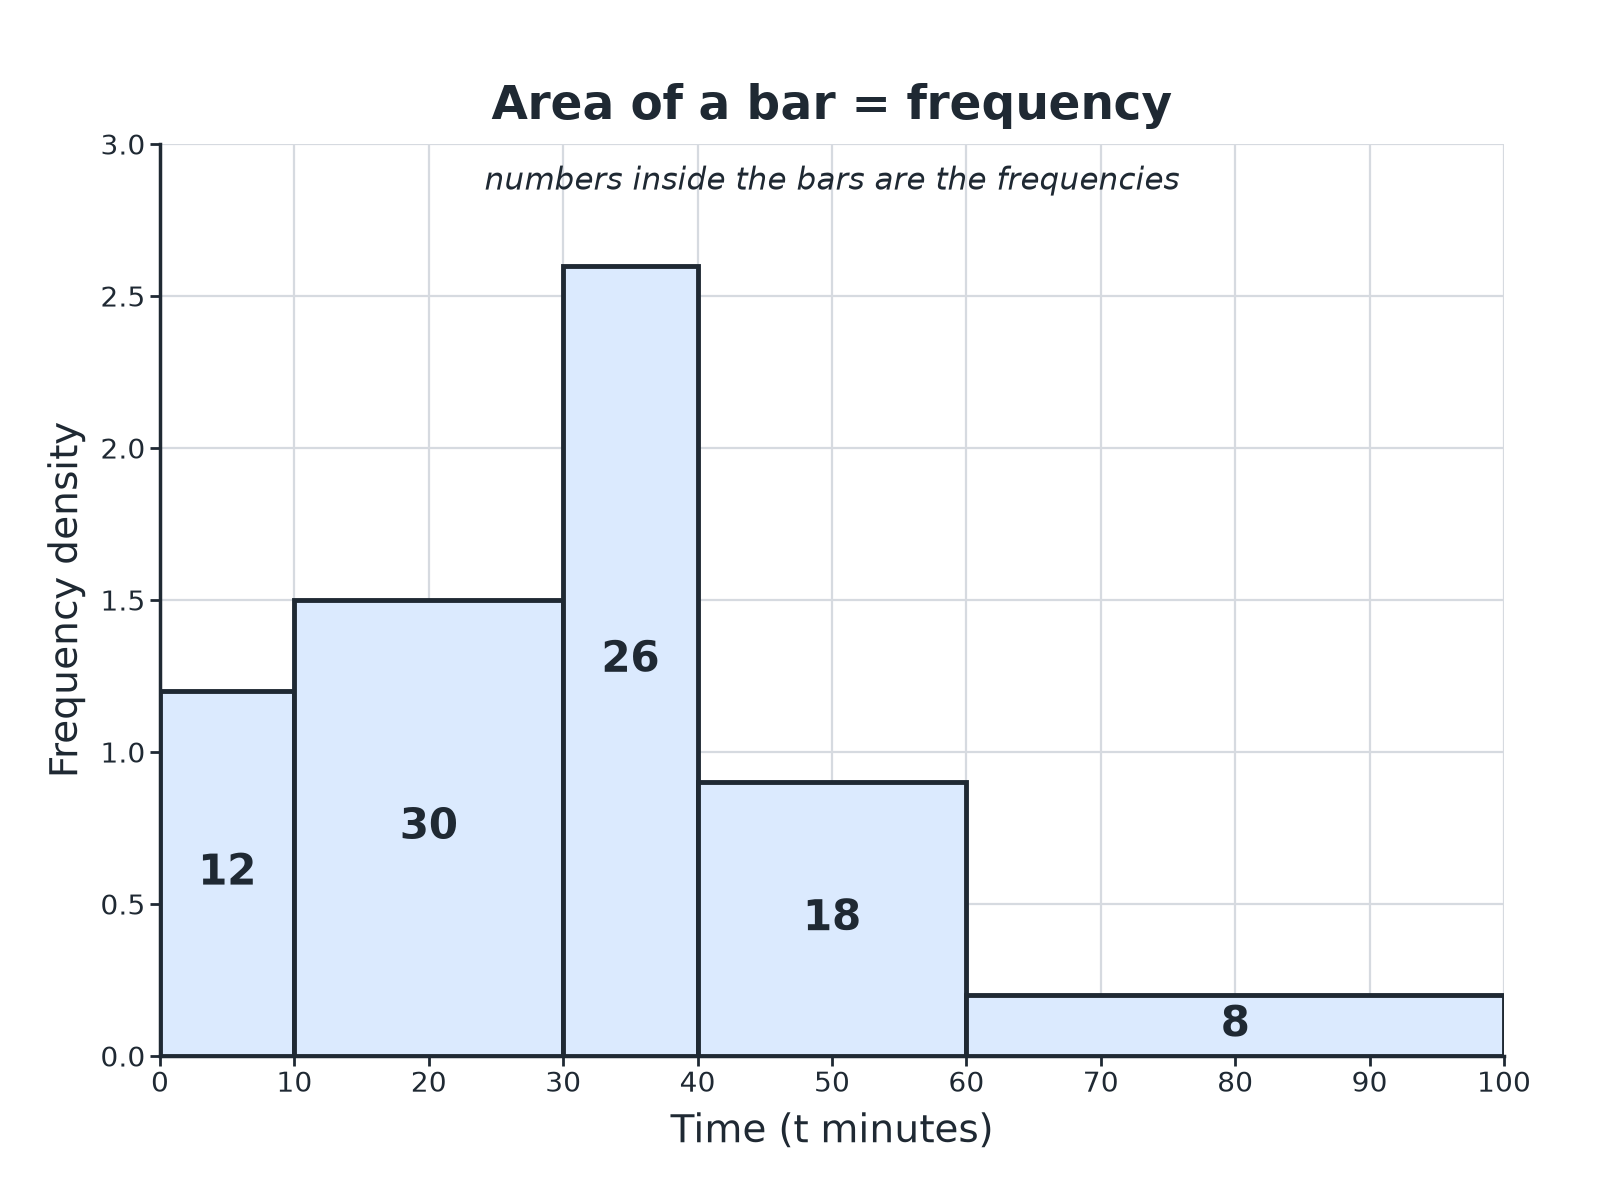
Wider bars are shorter for the same frequency.
Working Out Frequency Density
Times taken (t minutes) by 94 customers.
-
\(0 < t \le 10\)
Frequency: \(12\). Class width: \(10\). Frequency density: \(1.2\)
-
\(10 < t \le 30\)
Frequency: \(30\). Class width: \(20\). Frequency density: \(1.5\)
-
\(30 < t \le 40\)
Frequency: \(26\). Class width: \(10\). Frequency density: \(2.6\)
-
\(40 < t \le 60\)
Frequency: \(18\). Class width: \(20\). Frequency density: \(0.9\)
-
\(60 < t \le 100\)
Frequency: \(8\). Class width: \(40\). Frequency density: \(0.2\)
Drawing a Histogram
Follow the steps.
-
1
Work out the class widths
Upper boundary minus lower boundary
-
2
Work out the frequency density
Frequency divided by class width
-
3
Draw the axes
Data on the horizontal axis, frequency density on the vertical axis
-
4
Draw the bars
Bars touch; the height is the frequency density
-
5
Label
Add a scale and a label for each axis
Frequency Density
A class \(20 < x \le 50\) has frequency 60. Work out the frequency density.
Show the solutionHide the solution
- 1 Class width \(50 - 20 = 30\)
- 2 Divide \(\dfrac{60}{30} = 2\)
AnswerThe frequency density is 2, so the bar has height 2.
Completing a Histogram
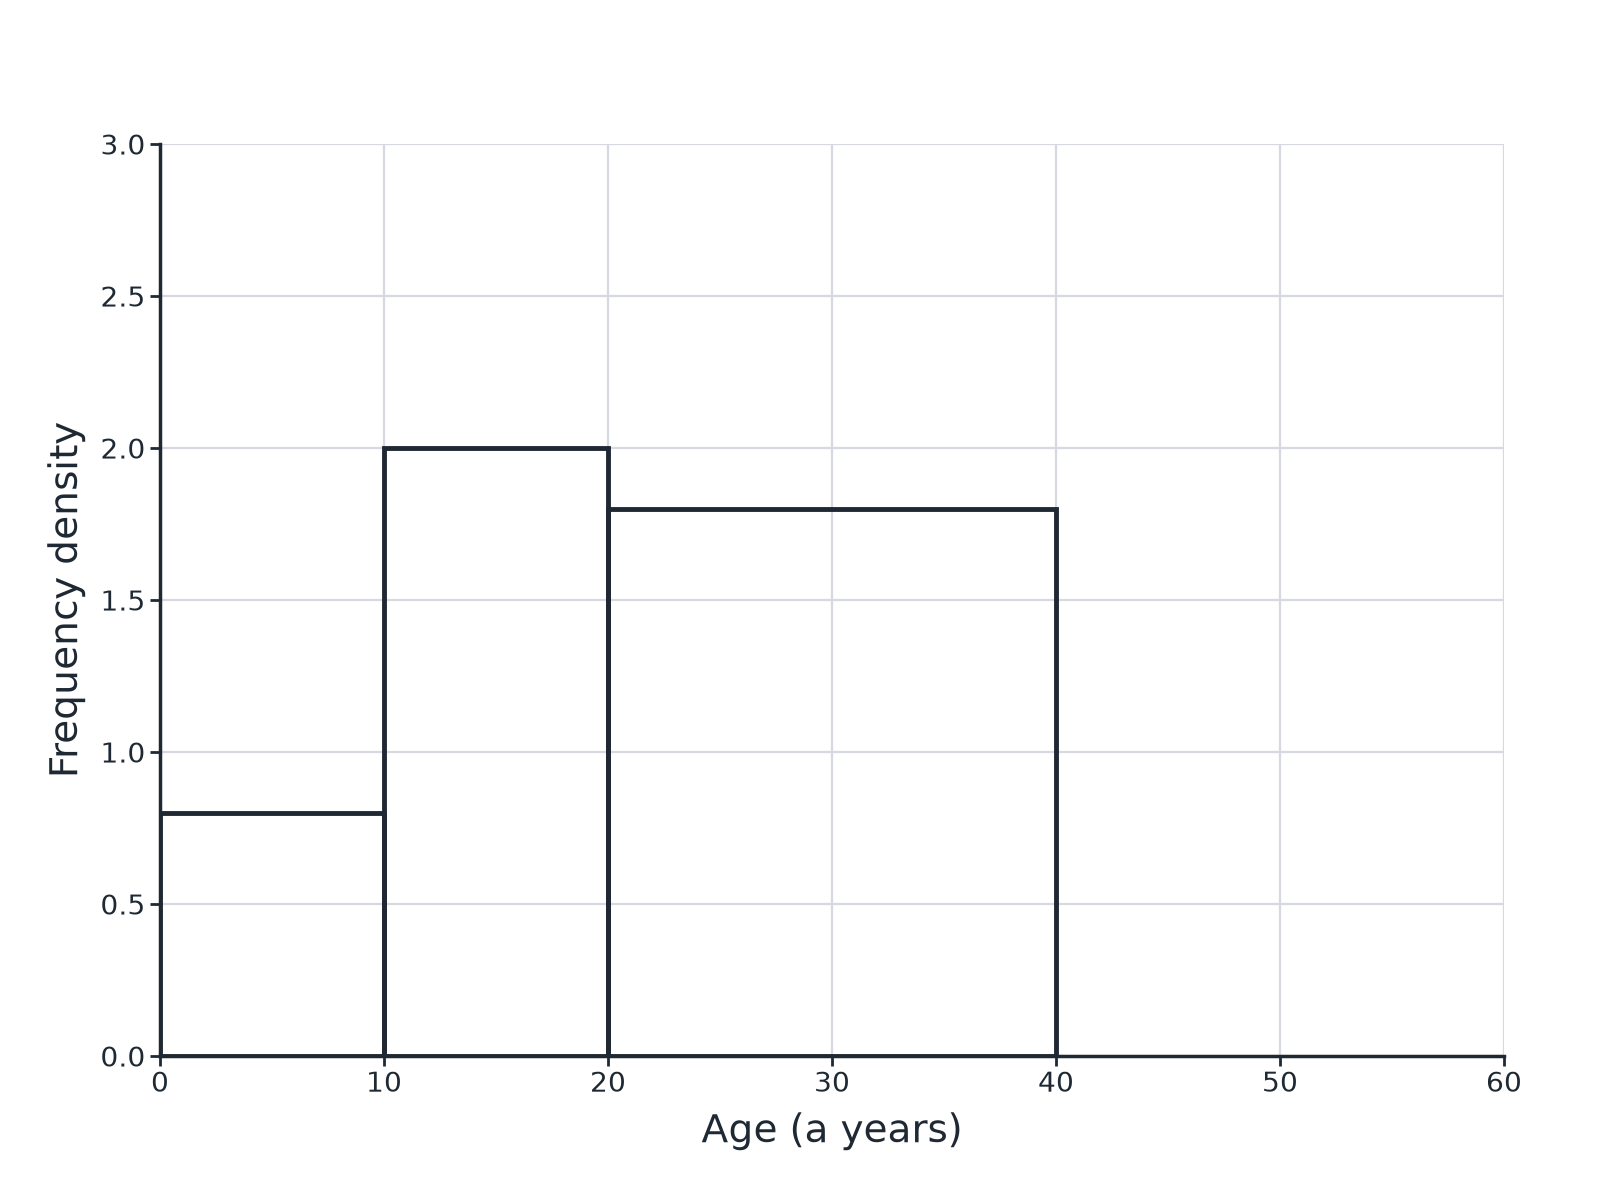
Age (a years): \(0 < a \le 10\): 8, \(10 < a \le 20\): 20, \(20 < a \le 40\): 36, \(40 < a \le 60\): 30. The first three bars are drawn. Work out the height of the last bar.
Show the solutionHide the solution
- 1 Class width \(60 - 40 = 20\)
- 2 Frequency density \(\dfrac{30}{20} = 1.5\)
AnswerDraw a bar from 40 to 60 with height 1.5.
Common Mistakes
Watch for these.
-
Frequency as the height
Use frequency density.
-
Gaps between bars
The bars must touch.
-
Widths
Use the actual class width, not the number of classes.
-
Labels
The vertical axis is "Frequency density", not "Frequency".
Find the Density
Work out the frequency density for each class. (a) \(0 < w \le 5\), frequency 15 (b) \(5 < w \le 15\), frequency 40 (c) \(15 < w \le 35\), frequency 30 (d) \(35 < w \le 60\), frequency 10.
1. Class width first.
2. Then divide.
A good answer shows: (a) 3 (b) 4 (c) 1.5 (d) 0.4
Can I...?
- 1Find the class widths.
- 2Work out frequency density.
- 3Draw and label axes.
- 4Draw bars that touch.
- 5Use unequal class widths.
- 6Complete a partly drawn histogram.
- 7Explain why frequency density is used.
- 8Avoid common mistakes.
Summary & Exam Focus
- Frequency density \(= \dfrac{\text{frequency}}{\text{class width}}\).
- Area of bar = frequency.
- Bars touch; classes may have different widths.
- The vertical axis is frequency density.
Exam focus
A table shows the ages of 94 people in classes with different widths. Work out the frequency density for each class and draw the histogram. (4 marks) (4 marks)
Add a frequency density column to the table first.
Key terms
The vocabulary this lesson expects you to use. Each one is linked from the first place it appears above.
- Histogram
- A chart where bar area shows frequency.
- Frequency density
- Frequency divided by class width.
- Class width
- The upper boundary minus the lower boundary.
- Continuous data
- Data measured, not counted.
- Unequal class widths
- Classes of different sizes.
- Area
- Height multiplied by width.
Questions and answers
12 questions set on this lesson, with the mark schemes and model answers open.
The table shows the times, t minutes, taken by 94 customers. Frequencies: \(0 < t \le 10\): 12, \(10 < t \le 30\): 30, \(30 < t \le 40\): 26, \(40 < t \le 60\): 18, \(60 < t \le 100\): 8. Work out the frequency density for each class.
Mark scheme — 3 marks available
- Class widths — M1
- At least three correct — M1
- All correct — A1
Model answer
1.2, 1.5, 2.6, 0.9, 0.2
The table shows information about the ages, a years, of 94 people: \(0 < a \le 10\): 8, \(10 < a \le 20\): 20, \(20 < a \le 40\): 36, \(40 < a \le 60\): 30. Complete the histogram.
Mark scheme — 3 marks available
- Frequency density 1.5 — M1
- Bar from 40 to 60 — A1
- Height 1.5 — A1
Model answer
Frequency density \(= 30 \div 20 = 1.5\); a bar drawn from 40 to 60 of height 1.5.
A class \(5 < x \le 25\) has frequency 40. Work out the frequency density.
Mark scheme — 2 marks available
- Class width 20 — M1
- 2 — A1
Model answer
\(40 \div 20 = 2\)
A histogram bar for the class \(10 < x \le 14\) has a frequency density of 3. Work out the frequency of the class.
Mark scheme — 2 marks available
- Uses \(4 \times 3\) — M1
- 12 — A1
Model answer
Width \(4\); frequency \(= 4 \times 3 = 12\)
Explain why the height of a bar in a histogram is not the frequency when the class widths are unequal.
Mark scheme — 2 marks available
- Area shows frequency — M1
- Frequency density used for the height — C1
Model answer
The area of a bar shows the frequency, so a wider class needs a lower bar for the same frequency. The height is the frequency density.
Describe how to draw a histogram from a grouped frequency table with unequal class widths.
Mark scheme — 3 marks available
- Frequency density — B1
- Axes correctly labelled — B1
- Touching bars with correct heights — B1
Model answer
Work out the class width and then the frequency density for each class. Draw a frequency density scale on the vertical axis and the data on the horizontal axis. Draw touching bars with heights equal to the frequency densities.
Frequency density is...
Why: Frequency divided by class width.
What is shown by the area of a bar in a histogram?
Why: The frequency.
A class of width 20 has frequency 30. Its frequency density is...
Why: \(30 \div 20 = 1.5\).
Bars in a histogram...
Why: Touch, because the data is continuous.
The vertical axis of a histogram is labelled...
Why: Frequency density.
Class width 5 and frequency density 4 give a frequency of...
Why: \(5 \times 4 = 20\).