Viewing as
Teacher view: planning notes, the answers to every question, and the teacher copies of the files.
Maths · Further statistics
Interpreting histograms
Read frequencies from histograms using area, estimate the number in part of a class, and estimate the median and mean.
Teacher resources
The teacher copies: slides with the questions built in, the answers, and anything else attached to this lesson for whoever is teaching it.
- Interpreting histograms - Teacher Slides.pptx Teacher The lesson slides with the teacher's notes on each slide, and every question and mark scheme built in. Built from the lesson script on 30 September 2026. View
- Interpreting histograms - Teacher Notes.docx Teacher The complete notes with the teacher's notes and every model answer in full. Built from the lesson script on 30 September 2026. View
Student handouts
The same files the students see, to print or hand out.
- Interpreting histograms.pptx Built from the lesson script on 30 September 2026. View
- Interpreting histograms - Completed Notes.docx The full notes for the lesson, to revise from. Built from the lesson script on 30 September 2026. View
- Interpreting histograms - Exam Questions.docx Built from the lesson script on 30 September 2026. View
Warm-up
Answer each one, then check.
-
1
What is frequency density?
Show answerHide answer
Frequency divided by class width
-
2
Work out \(20 \times 1.5\).
Show answerHide answer
\(30\)
-
3
What is the midpoint of the class \(20 < x \le 40\)?
Show answerHide answer
\(30\)
-
4
How do you estimate a mean from grouped data?
Show answerHide answer
Add up midpoint times frequency, divide by total frequency
-
5
What is the median position for 124 values?
Show answerHide answer
The 62nd value
Learning Objectives
READING A HISTOGRAM
Frequency = frequency density \(\times\) class width. That is the area of the bar.
To estimate a frequency for part of a class, use the width of just that part.
Area Shows Frequency
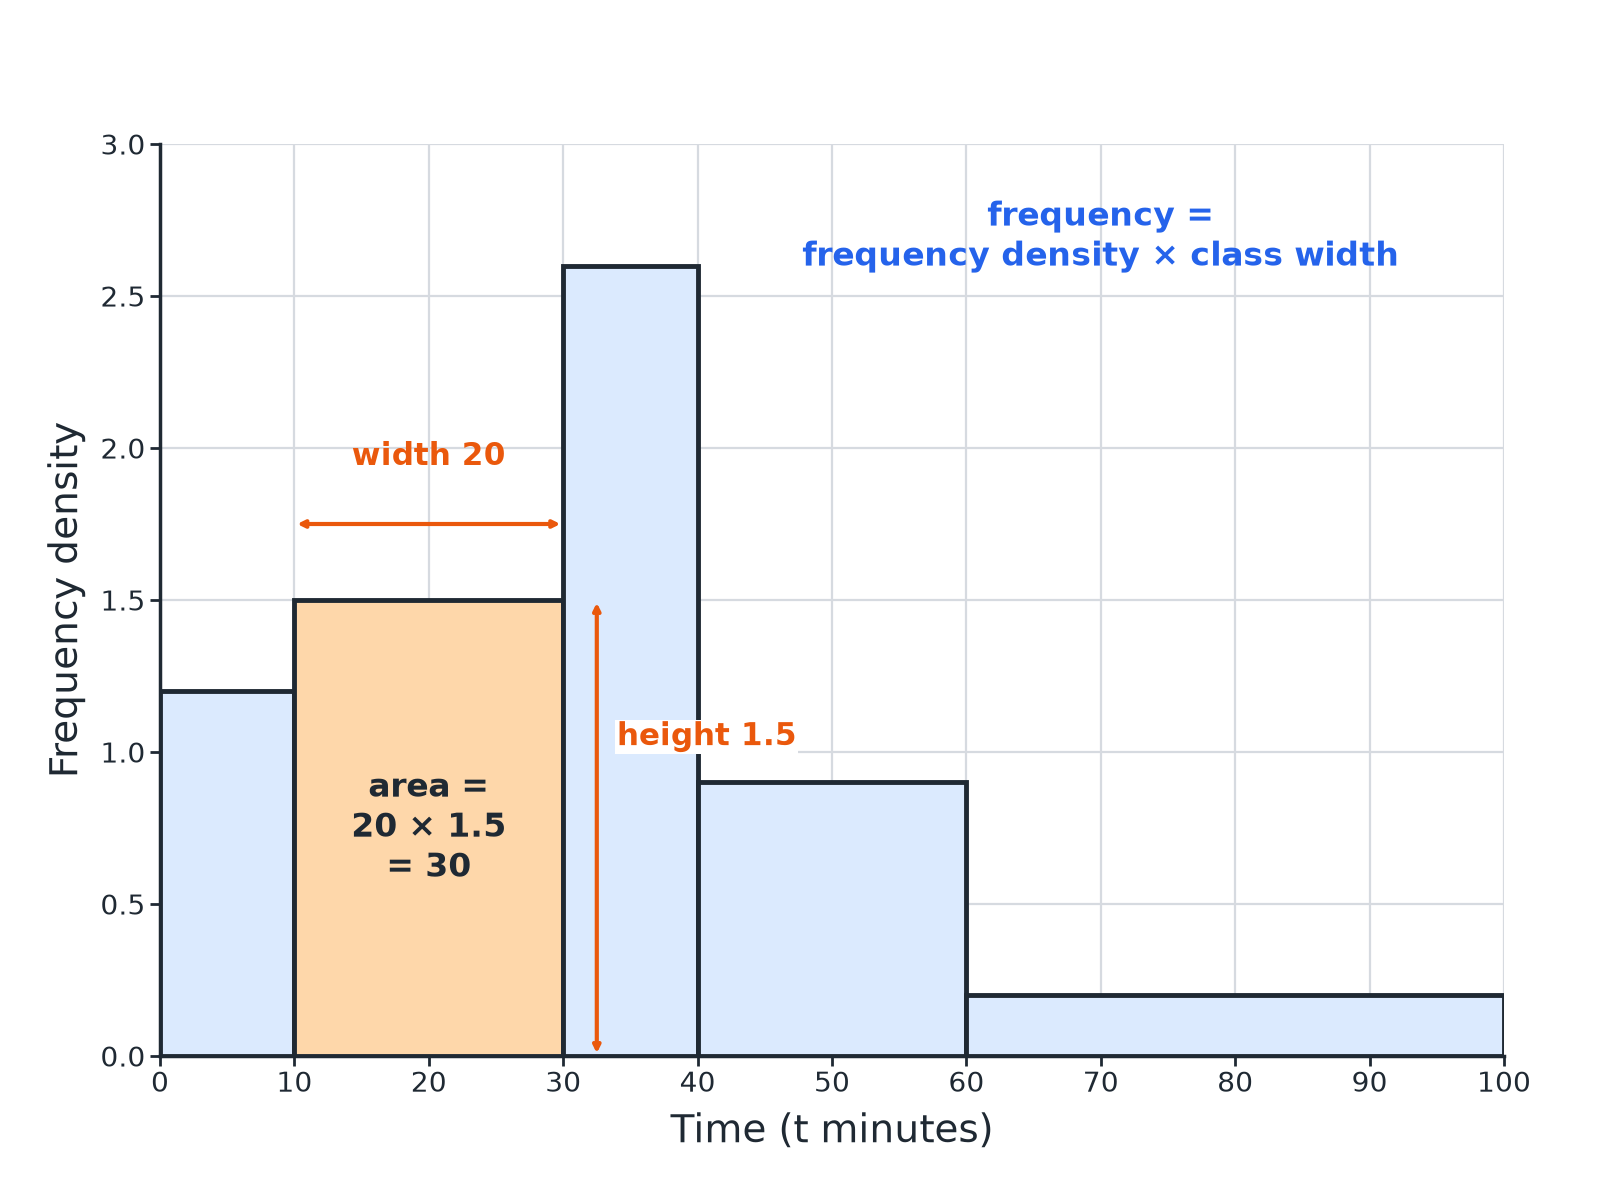
Area of the bar = frequency.
Frequency from a Bar
A histogram bar for the class \(10 < t \le 30\) has height 1.5. Find the frequency.
Show the solutionHide the solution
- 1 Class width \(30 - 10 = 20\)
- 2 Multiply \(20 \times 1.5 = 30\)
AnswerThe frequency is 30.
Part of a Class
In the class \(20 < x \le 40\) the frequency density is 2.2. Estimate the number of values between 25 and 40.
Show the solutionHide the solution
- 1 Width of the part \(40 - 25 = 15\)
- 2 Multiply \(15 \times 2.2 = 33\)
AnswerAbout 33 values.
Estimating the Median
Frequencies of 16, 30, 44, 24 and 10 are in classes \(0-10\), \(10-20\), \(20-40\), \(40-70\), \(70-90\) (total 124). The frequency density of \(20-40\) is 2.2. Estimate the median.
Show the solutionHide the solution
- 1 Position \(124 \div 2 = 62\)
- 2 Running total \(16 + 30 = 46\), so the median is in \(20-40\)
- 3 Values needed in this class \(62 - 46 = 16\)
- 4 Width needed \(16 \div 2.2 = 7.27\)
- 5 Median \(20 + 7.27 = 27.3\)
AnswerThe median is about 27.3.
Estimating the Mean
Use the same data to estimate the mean.
Show the solutionHide the solution
- 1 Midpoints \(5,\ 15,\ 30,\ 55,\ 80\)
- 2 Multiply \(80 + 450 + 1320 + 1320 + 800 = 3970\)
- 3 Divide by 124 \(3970 \div 124 = 32.0\)
AnswerThe mean is about 32.0.
Reading Tips
Keep the method tidy.
-
Add a frequency column
Work out each bar's frequency first.
-
Running totals
Use them to find the median class.
-
Median
Interpolate inside the median class.
-
Estimates
Values from grouped data are only estimates.
Read the Bars
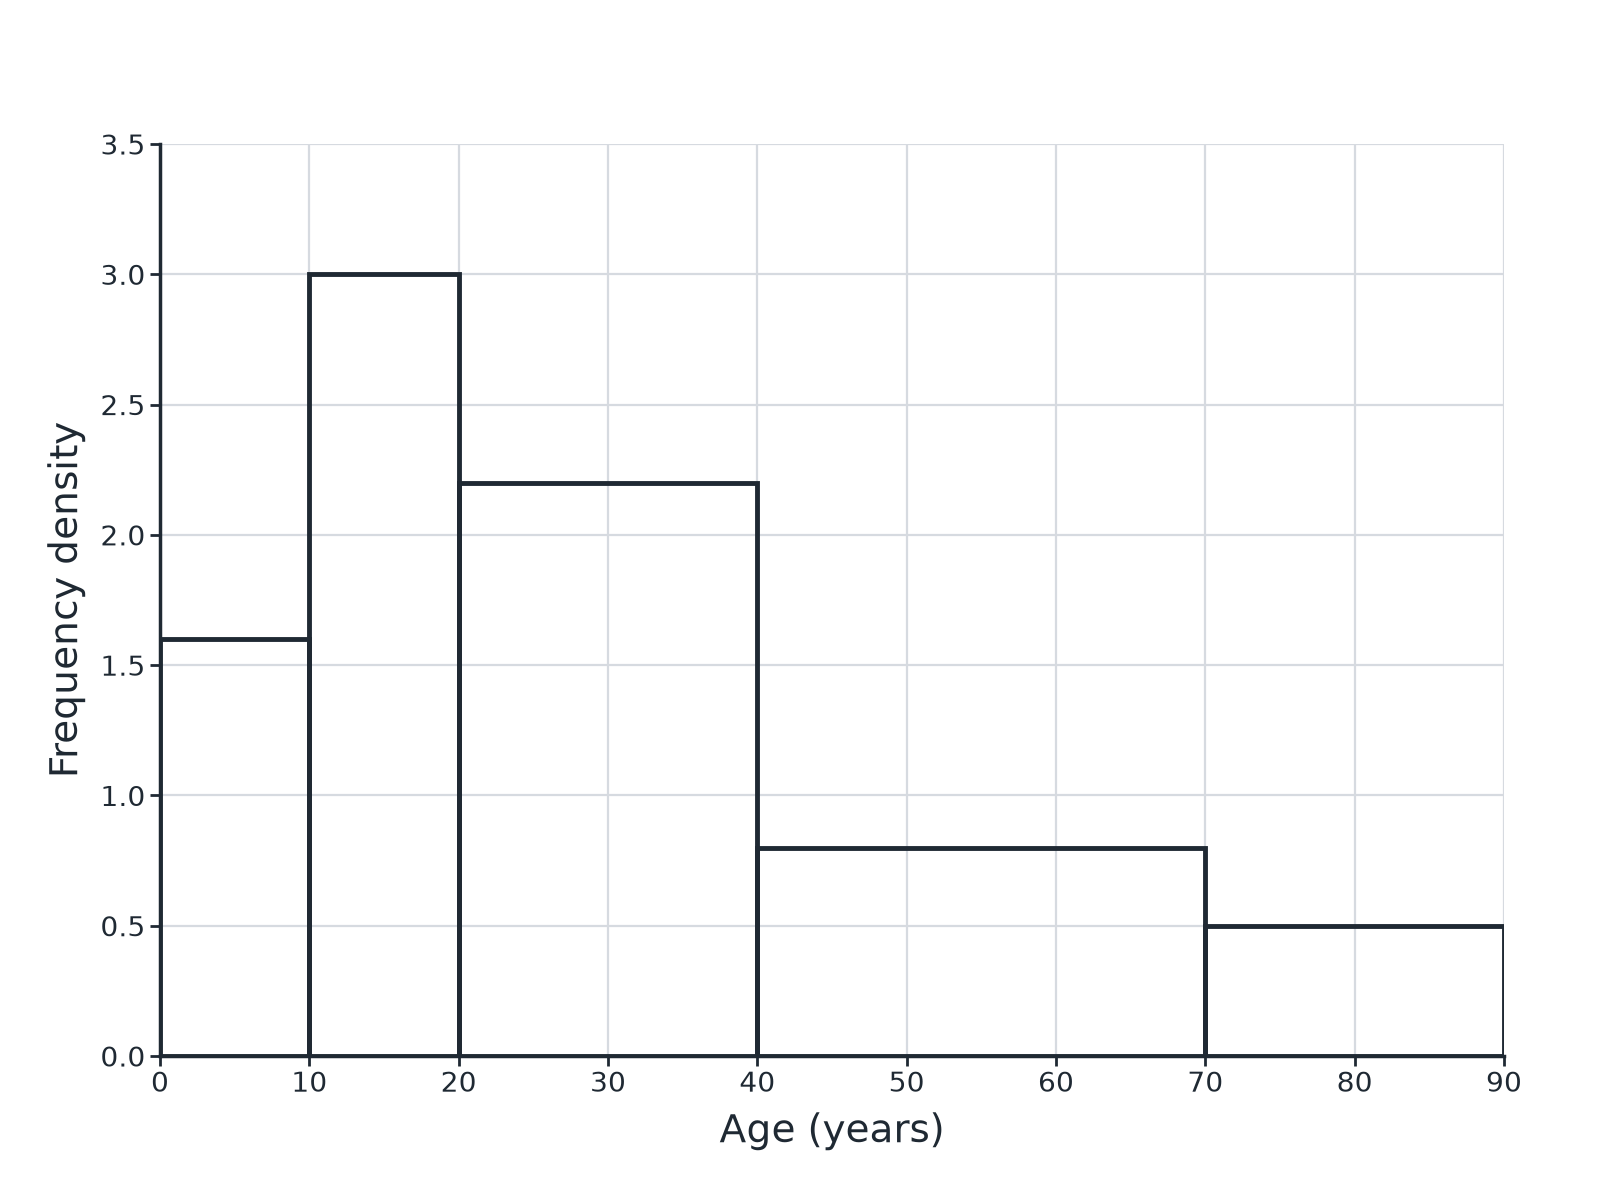
A histogram has bars: \(0-10\) height 1.6, \(10-20\) height 3, \(20-40\) height 2.2, \(40-70\) height 0.8, \(70-90\) height 0.5. (a) Find each frequency. (b) Find the total. (c) Estimate the number aged 30 to 40.
1. Width times height.
2. Add them up.
A good answer shows: (a) 16, 30, 44, 24, 10. (b) 124. (c) \(10 \times 2.2 = 22\).
Can I...?
- 1Find frequency from area.
- 2Find the total frequency.
- 3Estimate part of a class.
- 4Find the median class.
- 5Interpolate the median.
- 6Work out midpoints.
- 7Estimate the mean.
- 8Explain why answers are estimates.
Summary & Exam Focus
- Frequency \(=\) frequency density \(\times\) class width.
- Median: find the class, then interpolate.
- Mean: \(\dfrac{\sum (\text{midpoint} \times \text{frequency})}{\text{total frequency}}\).
- Grouped answers are estimates.
Exam focus
The histogram shows the ages of visitors to a museum. Work out an estimate for the number of visitors aged 25 to 40. (3 marks) (3 marks)
Use the class width of only the part you need.
Key terms
The vocabulary this lesson expects you to use. Each one is linked from the first place it appears above.
- Frequency density
- Height of a histogram bar.
- Estimate
- An approximate answer from grouped data.
- Midpoint
- The middle of a class.
- Median class
- The class that contains the median.
- Interpolate
- Find a value part of the way through a class.
- Area
- Width times height.
Questions and answers
12 questions set on this lesson, with the mark schemes and model answers open.
The histogram gives information about the ages of visitors to a museum. (a) Work out the number of visitors aged 10 to 20. (b) Work out an estimate for the number of visitors aged 25 to 40.
Mark scheme — 4 marks available
- \(10 \times 3\) — M1
- 30 — A1
- \(15 \times 2.2\) — M1
- 33 — A1
Model answer
(a) \(10 \times 3 = 30\). (b) \(15 \times 2.2 = 33\).
Use the same histogram to work out the total number of visitors.
Mark scheme — 2 marks available
- All five frequencies — M1
- 124 — A1
Model answer
\(16 + 30 + 44 + 24 + 10 = 124\)
Use the same histogram to find an estimate for the median age.
Mark scheme — 3 marks available
- Median position 62 — B1
- Interpolates in the class 20 to 40 — M1
- 27.3 (accept 27 to 27.5) — A1
Model answer
Median position 62; running total 46 after age 20; \(62 - 46 = 16\); \(16 \div 2.2 = 7.27\); median \(\approx 27.3\).
Use the same histogram to find an estimate for the mean age of the visitors.
Mark scheme — 3 marks available
- Midpoints times frequencies — M1
- 3970 — A1
- 32.0 — A1
Model answer
\(\dfrac{16 \times 5 + 30 \times 15 + 44 \times 30 + 24 \times 55 + 10 \times 80}{124} = \dfrac{3970}{124} = 32.0\)
A histogram bar for a class of width 20 has height 1.4. Work out the frequency of the class.
Mark scheme — 2 marks available
- Uses \(20 \times 1.4\) — M1
- 28 — A1
Model answer
\(20 \times 1.4 = 28\)
Explain why the answer to part (b) of the first question is only an estimate.
Mark scheme — 2 marks available
- Data grouped — M1
- Assumes even spread — C1
Model answer
The data are grouped, so we do not know how the values are spread inside the class. We assumed they are evenly spread.
To find a frequency from a histogram bar, you...
Why: Multiply the height by the width.
A bar has width 10 and height 3. Frequency...
Why: \(10 \times 3 = 30\).
To estimate the number in 25 to 40 from a class 20 to 40, use the width...
Why: 15, the width of the part you need.
For 124 values, the median is the...
Why: The 62nd value.
The midpoint of the class 40 to 70 is...
Why: \((40 + 70) \div 2 = 55\).
Why are mean values from a histogram estimates?
Why: We use the midpoint of each class, not the actual values.