Viewing as
Teacher view: planning notes, the answers to every question, and the teacher copies of the files.
Physics · Forces
Distance–time graphs
Draw and interpret distance–time graphs and use gradients to find speed (and tangents for accelerating objects at Higher tier).
Teacher resources
The teacher copies: slides with the questions built in, the answers, and anything else attached to this lesson for whoever is teaching it.
- Distancetime graphs - Teacher Slides.pptx Teacher The lesson slides with the teacher's notes on each slide, and every question and mark scheme built in. Built from the lesson script on 30 September 2026. View
- Distancetime graphs - Teacher Notes.docx Teacher The complete notes with the teacher's notes and every model answer in full. Built from the lesson script on 30 September 2026. View
Student handouts
The same files the students see, to print or hand out.
- Distancetime graphs.pptx Built from the lesson script on 30 September 2026. View
- Distancetime graphs - Completed Notes.docx The full notes for the lesson, to revise from. Built from the lesson script on 30 September 2026. View
- Distancetime graphs - Exam Questions.docx Built from the lesson script on 30 September 2026. View
Warm-up
Answer each one, then check.
-
1
What is the gradient of a graph?
Show answerHide answer
Change in y divided by change in x
-
2
What does a horizontal line on a distance-time graph mean?
Show answerHide answer
The object is stationary
-
3
What is speed?
Show answerHide answer
Distance divided by time
-
4
What is acceleration?
Show answerHide answer
Rate of change of velocity
-
5
What does a steeper line mean?
Show answerHide answer
A faster speed
Learning Objectives
- 1Draw distance–time graphs from measurements.
- 2Interpret lines and slopes of distance–time graphs.
- 3Calculate speed from the gradient of a distance–time graph.
- 4Find the speed of an accelerating object at an instant using a tangent (Higher tier).
DISTANCE–TIME GRAPHS
The gradient of a distance–time graph is the speed of the object.
A straight line means constant speed, a horizontal line means stationary, and a curve means the speed is changing.
Reading a Distance–Time Graph
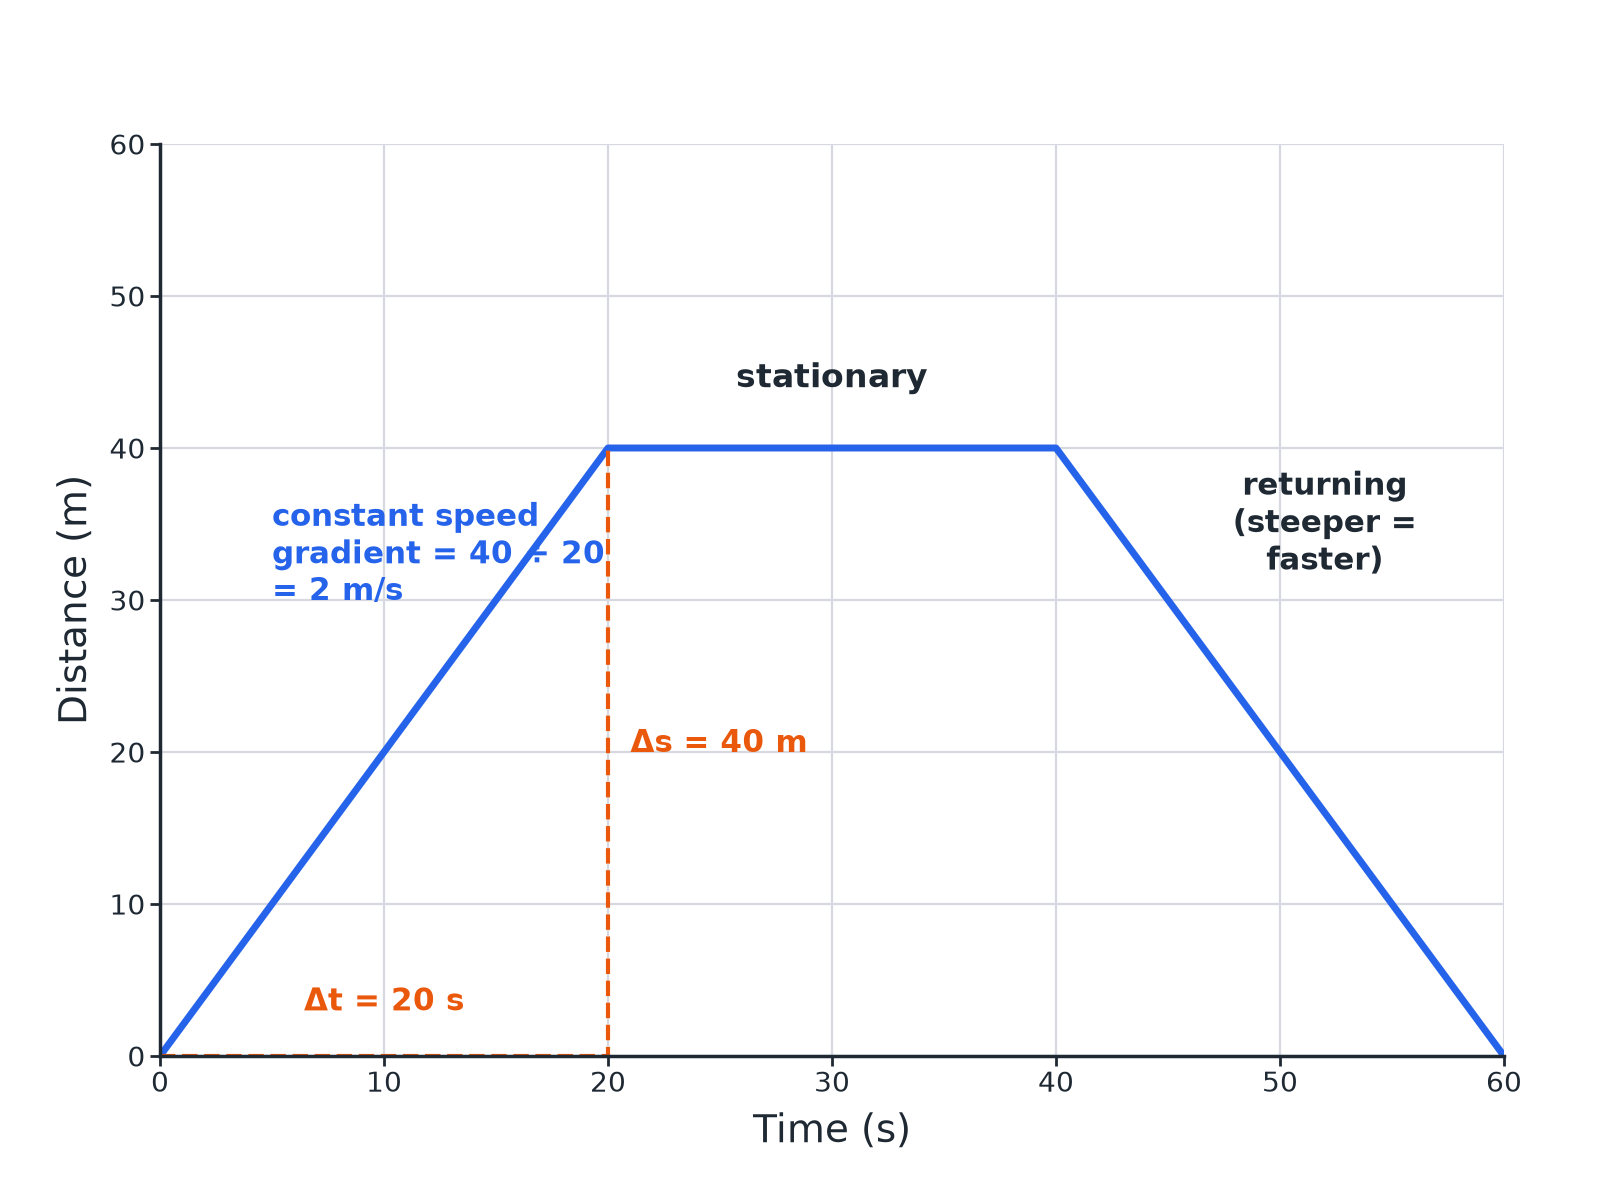
Gradient = change in distance ÷ change in time.
What the Graph Shows
Learn these.
-
Straight line sloping up
Meaning: Constant speed
-
Horizontal line
Meaning: Stationary
-
Steeper line
Meaning: Higher speed
-
Curve getting steeper
Meaning: Accelerating
-
Curve getting shallower
Meaning: Decelerating
Speed from a Gradient
An object travels 40 m in the first 20 s. Calculate its speed from the graph.
Show the solutionHide the solution
- 1 Gradient \(\dfrac{\text{change in distance}}{\text{change in time}}\)
- 2 Substitute \(\dfrac{40}{20}\)
- 3 Answer \(2.0\) m/s
Answer2.0 m/s
Describing a Journey
Describe the motion shown from 20 s to 40 s where the line is horizontal.
Show the solutionHide the solution
- 1 Distance Does not change
- 2 Speed Zero
AnswerThe object is stationary.
Tangent (Higher)
The distance is given by s = 0.5t² (in metres, t in seconds). Find the speed at t = 6 s using a tangent.
Show the solutionHide the solution
- 1 Draw a tangent Touching the curve at t = 6 s
- 2 Gradient of the tangent \(\dfrac{\Delta s}{\Delta t}\) from two points on the tangent: about \(6\) m/s
- 3 Check The speed is t = 6 m/s from s = 0.5t²
AnswerAbout 6 m/s.
Drawing Graphs
Good practice.
-
Axes
Time on the x-axis, distance on the y-axis, with units.
-
Points
Plot from a table, then join with a ruler (or a smooth curve if the speed changes).
-
Gradient
Use a large triangle for accuracy.
-
Units
m/s if distance in m and time in s.
Story Graph
A cyclist travels 100 m in 20 s, stops for 20 s and then travels 60 m in 20 s. Sketch the graph and calculate the speed in each part.
1. Plot the three sections.
2. Gradient for each.
A good answer shows: Part 1: 5.0 m/s. Part 2: 0 m/s. Part 3: 3.0 m/s.
Can I...?
- 1Draw a distance–time graph.
- 2Say what a horizontal line means.
- 3Calculate speed from a gradient.
- 4Compare speeds from slopes.
- 5Describe a journey.
- 6Describe a curve.
- 7Draw a tangent.
- 8Use units.
Summary & Exam Focus
- Gradient = speed.
- Horizontal line = stationary.
- Steeper = faster.
- Higher: tangent to a curve gives instantaneous speed.
Exam focus
The graph shows 100 m in 20 s. Calculate the speed in the first 20 s. (2 marks) (2 marks)
Gradient = distance ÷ time.
Key terms
The vocabulary this lesson expects you to use. Each one is linked from the first place it appears above.
- Distance–time graph
- A graph of distance against time.
- Gradient
- How steep a line is.
- Stationary
- Not moving.
- Tangent
- A straight line that touches a curve at one point.
- Constant speed
- The same speed all the time.
- Accelerating
- Speeding up.
Questions and answers
10 questions set on this lesson, with the mark schemes and model answers open.
The graph shows the distance travelled by a cyclist. (a) Calculate the speed in the first 20 s. (b) Describe the motion between 20 s and 40 s. (c) Calculate the speed between 40 s and 60 s.
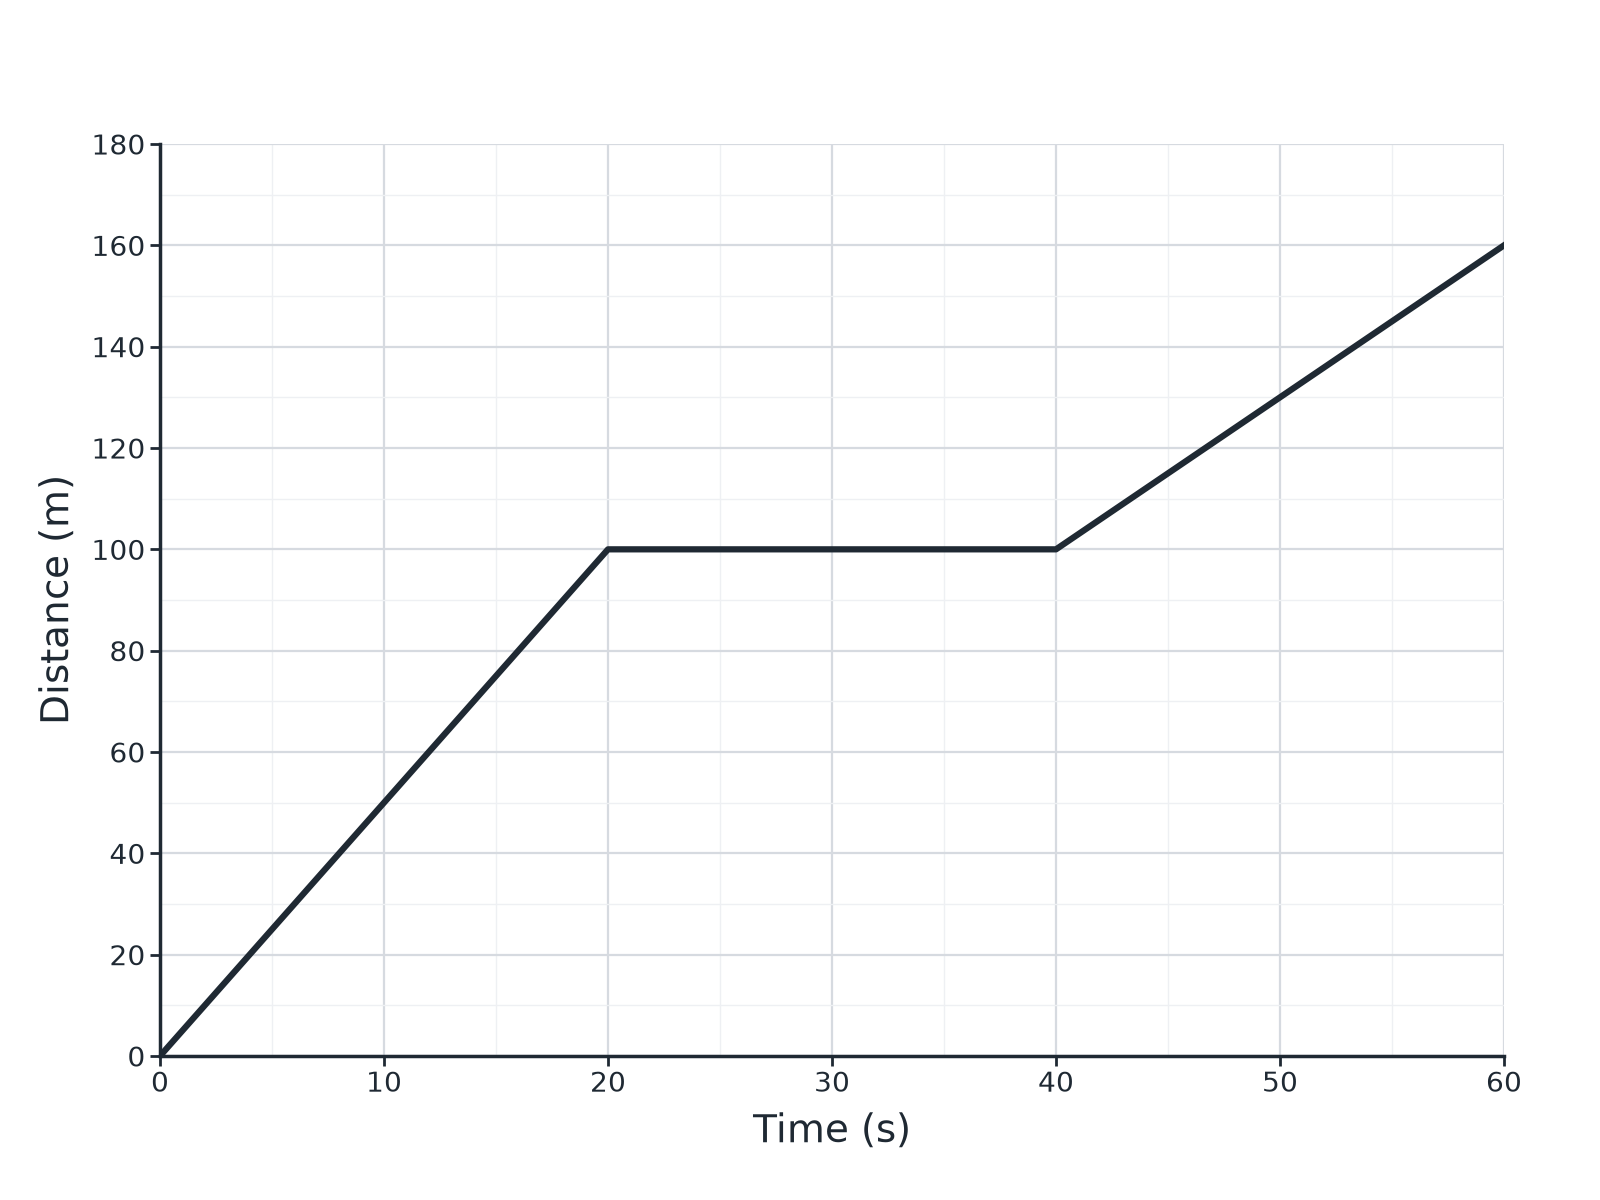
Mark scheme — 4 marks available
- 5.0 m/s — 1 mark
- Stationary — 1 mark
- Correct distance and time — 1 mark
- 3.0 m/s — 1 mark
Model answer
(a) 100 ÷ 20 = 5.0 m/s. (b) Stationary. (c) 60 ÷ 20 = 3.0 m/s.
Describe what the gradient of a distance–time graph represents and what a horizontal line shows.
Mark scheme — 2 marks available
- Gradient is speed — 1 mark
- Horizontal line: stationary — 1 mark
Model answer
The gradient is the speed. A horizontal line shows the object is stationary.
A car travels 120 m in 10 s at constant speed. Sketch a distance–time graph for this and calculate the gradient.
Mark scheme — 3 marks available
- Straight line from the origin — 1 mark
- Correct end point — 1 mark
- 12 m/s — 1 mark
Model answer
A straight line from the origin to (10 s, 120 m). Gradient = 120 ÷ 10 = 12 m/s.
The distance–time graph for a runner is a curve that gets steeper. Describe the motion.
Mark scheme — 2 marks available
- Accelerating — 1 mark
- Gradient or speed increases — 1 mark
Model answer
The runner is accelerating (the speed is increasing).
The graph shows the distance of a car from a starting point against time as a curve. Describe how to find the speed at a particular time.
Mark scheme — 3 marks available
- Draw a tangent — 1 mark
- Choose two points on the tangent — 1 mark
- Gradient = change in distance ÷ change in time — 1 mark
Model answer
Draw a tangent to the curve at that time and calculate its gradient (change in distance ÷ change in time).
The gradient of a distance–time graph is...
Why: Change in distance ÷ time.
A horizontal line means...
Why: Distance does not change.
A steeper line means a...
Why: Greater gradient.
80 m in 10 s gives a speed of...
Why: 80 ÷ 10.
A curve getting steeper shows...
Why: Speed is increasing.