Biology · Transport In and Out of Cells
Viewing as
Teacher view: every answer and mark scheme set out in full.
Investigating Osmosis in Plant Tissue
This is the core practical on osmosis. You put pieces of plant tissue in solutions of different concentrations and see whether they gain or lose mass. This lesson covers the method, the variables, the calculations, how to read the graph and how to improve the experiment.
Learning Objectives
- 1Describe a method to investigate the effect of different concentrations of salt or sugar solution on the mass of plant tissue.
- 2Identify the independent, dependent and control variables.
- 3Calculate the percentage change in mass.
- 4Plot, draw and interpret a graph, and use it to find the concentration at which there is no change in mass.
- 5Suggest how to improve the reliability and accuracy of the investigation.
Retrieval practice
-
1
What is osmosis?
Show answerHide answer
The diffusion of water from a dilute solution to a concentrated solution through a partially permeable membrane.
-
2
Which way does water move if a potato cell is in a solution more concentrated than its cell sap?
Show answerHide answer
Out of the cell.
-
3
What happens to a plant cell that gains water by osmosis?
Show answerHide answer
It becomes turgid.
-
4
What does a plant cell lose water to become?
Show answerHide answer
Flaccid.
Seeing osmosis happen
You cannot watch water molecules move, but you can weigh a piece of plant tissue before and after it has been sitting in a solution. If it gains mass, water has entered it. If it loses mass, water has left. By using several solutions of different concentrations you can build up a picture of how osmosis depends on concentration, and even work out the concentration of the solution inside the potato cells. Potato is used because it is cheap, easy to cut into identical pieces and has plenty of cells with a partially permeable membrane.
The aim and the idea
The investigation tests how the concentration of a salt or sugar solution affects the mass of plant tissue.
-
The question
How does the concentration of sugar (or salt) solution affect the mass of potato cylinders?
-
Why mass changes
Water moves in or out of the potato cells by osmosis, so the mass of the cylinder goes up or down.
-
If the potato gains mass
The solution is more dilute than the potato cell sap, so water has moved into the potato.
-
If the potato loses mass
The solution is more concentrated than the potato cell sap, so water has moved out of the potato.
The method
A typical version of the investigation uses sugar solutions from 0 mol/dm³ (pure water) to 1.0 mol/dm³.
-
1
Cut the potato
Use a cork borer to cut cylinders of potato, and cut them all to the same length. Remove the skin.
-
2
Measure the starting mass
Dry each cylinder and measure its mass on a balance. Record it.
-
3
Set up the solutions
Put the same volume of each sugar solution into labelled test tubes, from 0 up to 1.0 mol/dm³.
-
4
Add one cylinder to each tube
Make sure each is covered with solution. Leave them for the same length of time, for example 30 minutes.
-
5
Remove and dry
Take each cylinder out and blot it dry with paper towel to remove the solution from its surface.
-
6
Measure the final mass
Measure the mass again and record it next to the starting mass.
-
7
Calculate
Work out the percentage change in mass for each solution.
The method in pictures
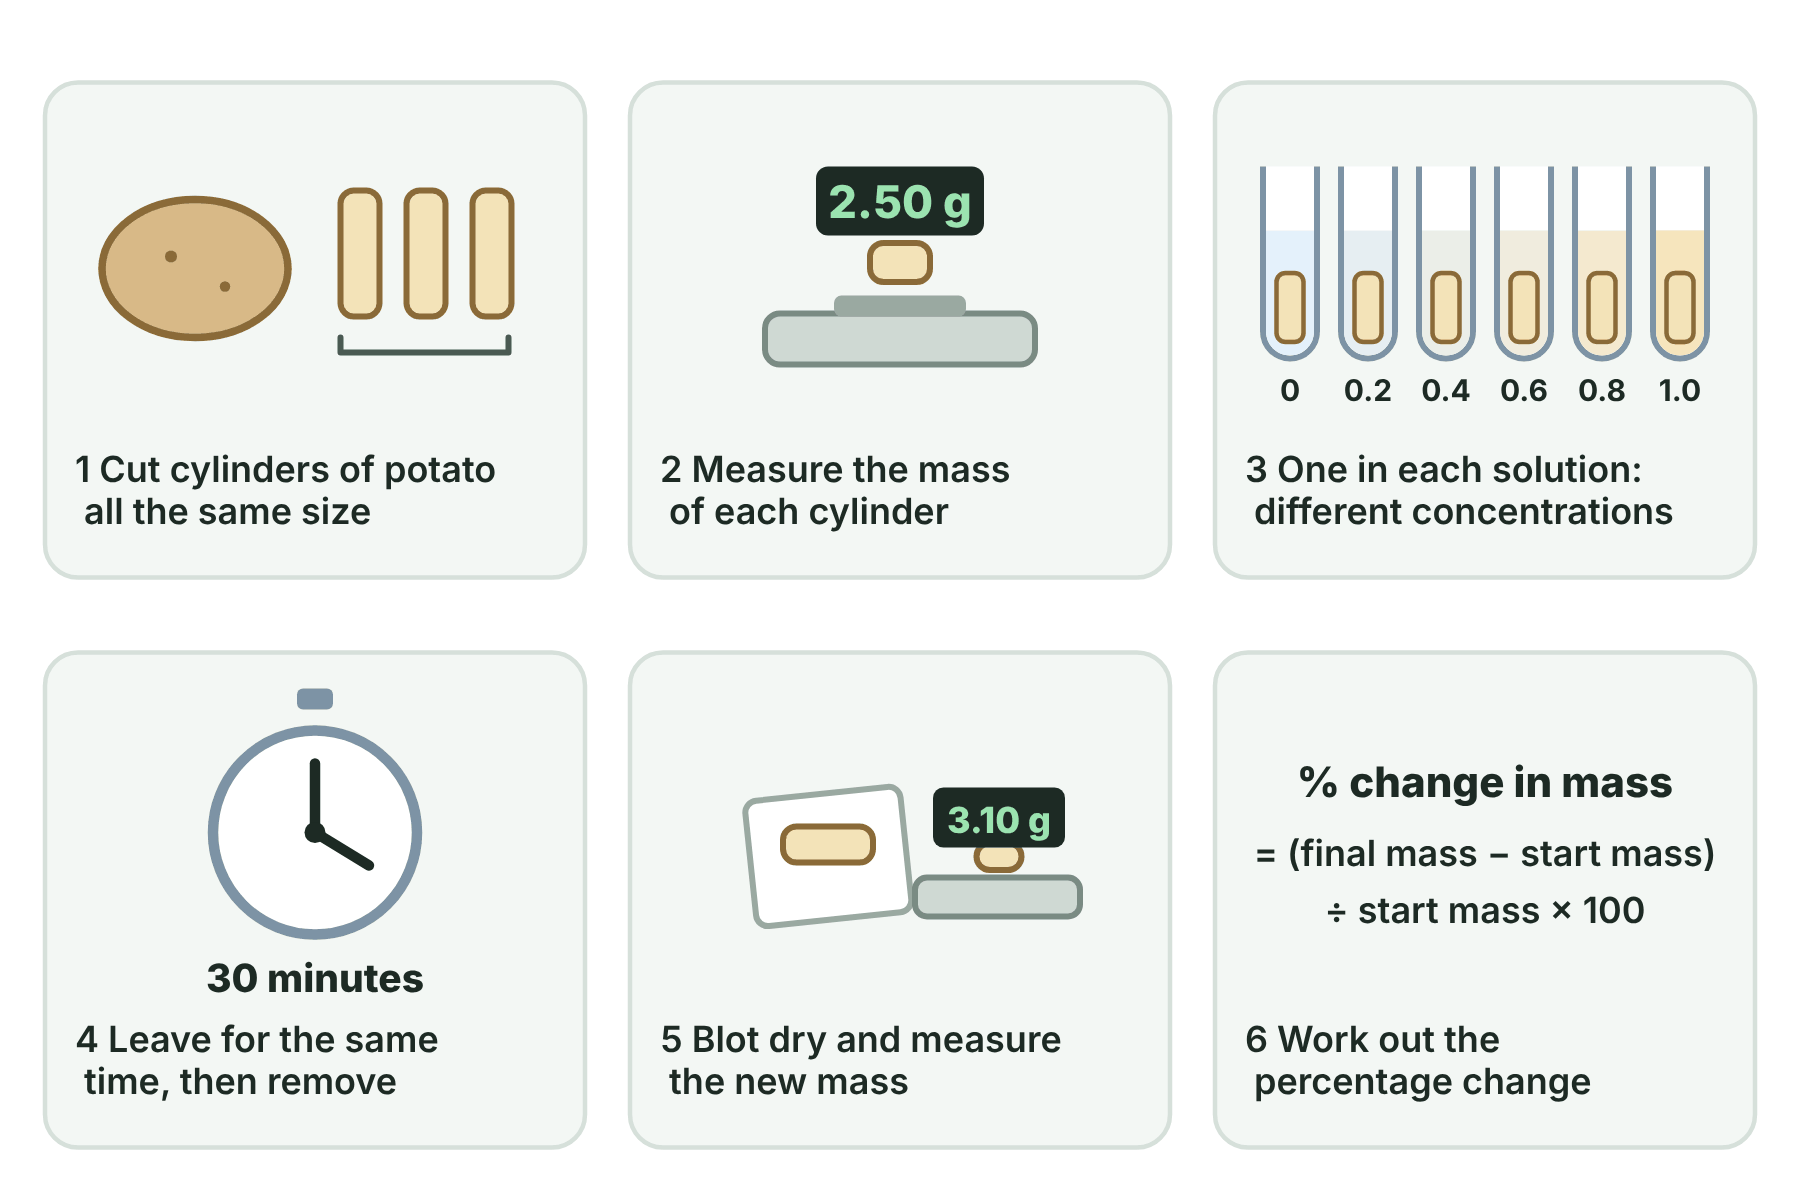
The practical in six steps.
The variables
To make it a fair test, only one thing may change.
-
Independent variable
The concentration of the solution, which is the one thing you change on purpose.
-
Dependent variable
The percentage change in mass of the potato, which is what you measure.
-
Control variables
These must be kept the same: the length and width of the cylinders, the type and age of the potato, the volume of solution, the temperature and the time left in the solution.
-
Why percentage change
Cylinders never start with exactly the same mass, so the change is worked out as a percentage of the starting mass. That makes the results fair to compare.
Calculating the percentage change in mass
A potato cylinder has a mass of 2.50 g at the start and 2.85 g after 30 minutes in a solution. Calculate the percentage change in mass. A second cylinder goes from 3.20 g to 2.72 g. Calculate its percentage change.
Show the solutionHide the solution
- 1 Find the change in mass Final mass − start mass. First cylinder: 2.85 − 2.50 = +0.35 g. Second: 2.72 − 3.20 = −0.48 g.
- 2 Divide by the start mass First: 0.35 ÷ 2.50 = 0.14. Second: −0.48 ÷ 3.20 = −0.15.
- 3 Multiply by 100 to give a percentage First: +14%. Second: −15%. A minus sign means a loss of mass.
AnswerThe first cylinder gained 14%. The second lost 15%.
Case study
Why percentages make the test fair
Imagine two cylinders in the same solution. One starts at 2.0 g and gains 0.2 g, and the other starts at 3.0 g and gains 0.3 g. The raw gains look different, 0.2 g and 0.3 g, but both cylinders have gained the same fraction of their mass. Calculating percentage change shows that the solution had the same effect on both.
Reading the results
Plot the percentage change in mass against the concentration of the solution, and draw a smooth line through the points.
-
Above zero
A gain in mass. Water entered the potato because the solution was more dilute than the cell sap.
-
Below zero
A loss in mass. Water left the potato because the solution was more concentrated than the cell sap.
-
Where the line crosses zero
No change in mass. The solution is the same concentration as the potato cell sap, so there is no net movement of water. Read the concentration off the x-axis.
-
The shape
As the concentration of the solution increases, the percentage change falls, going from a gain to a loss.
Results from a potato experiment
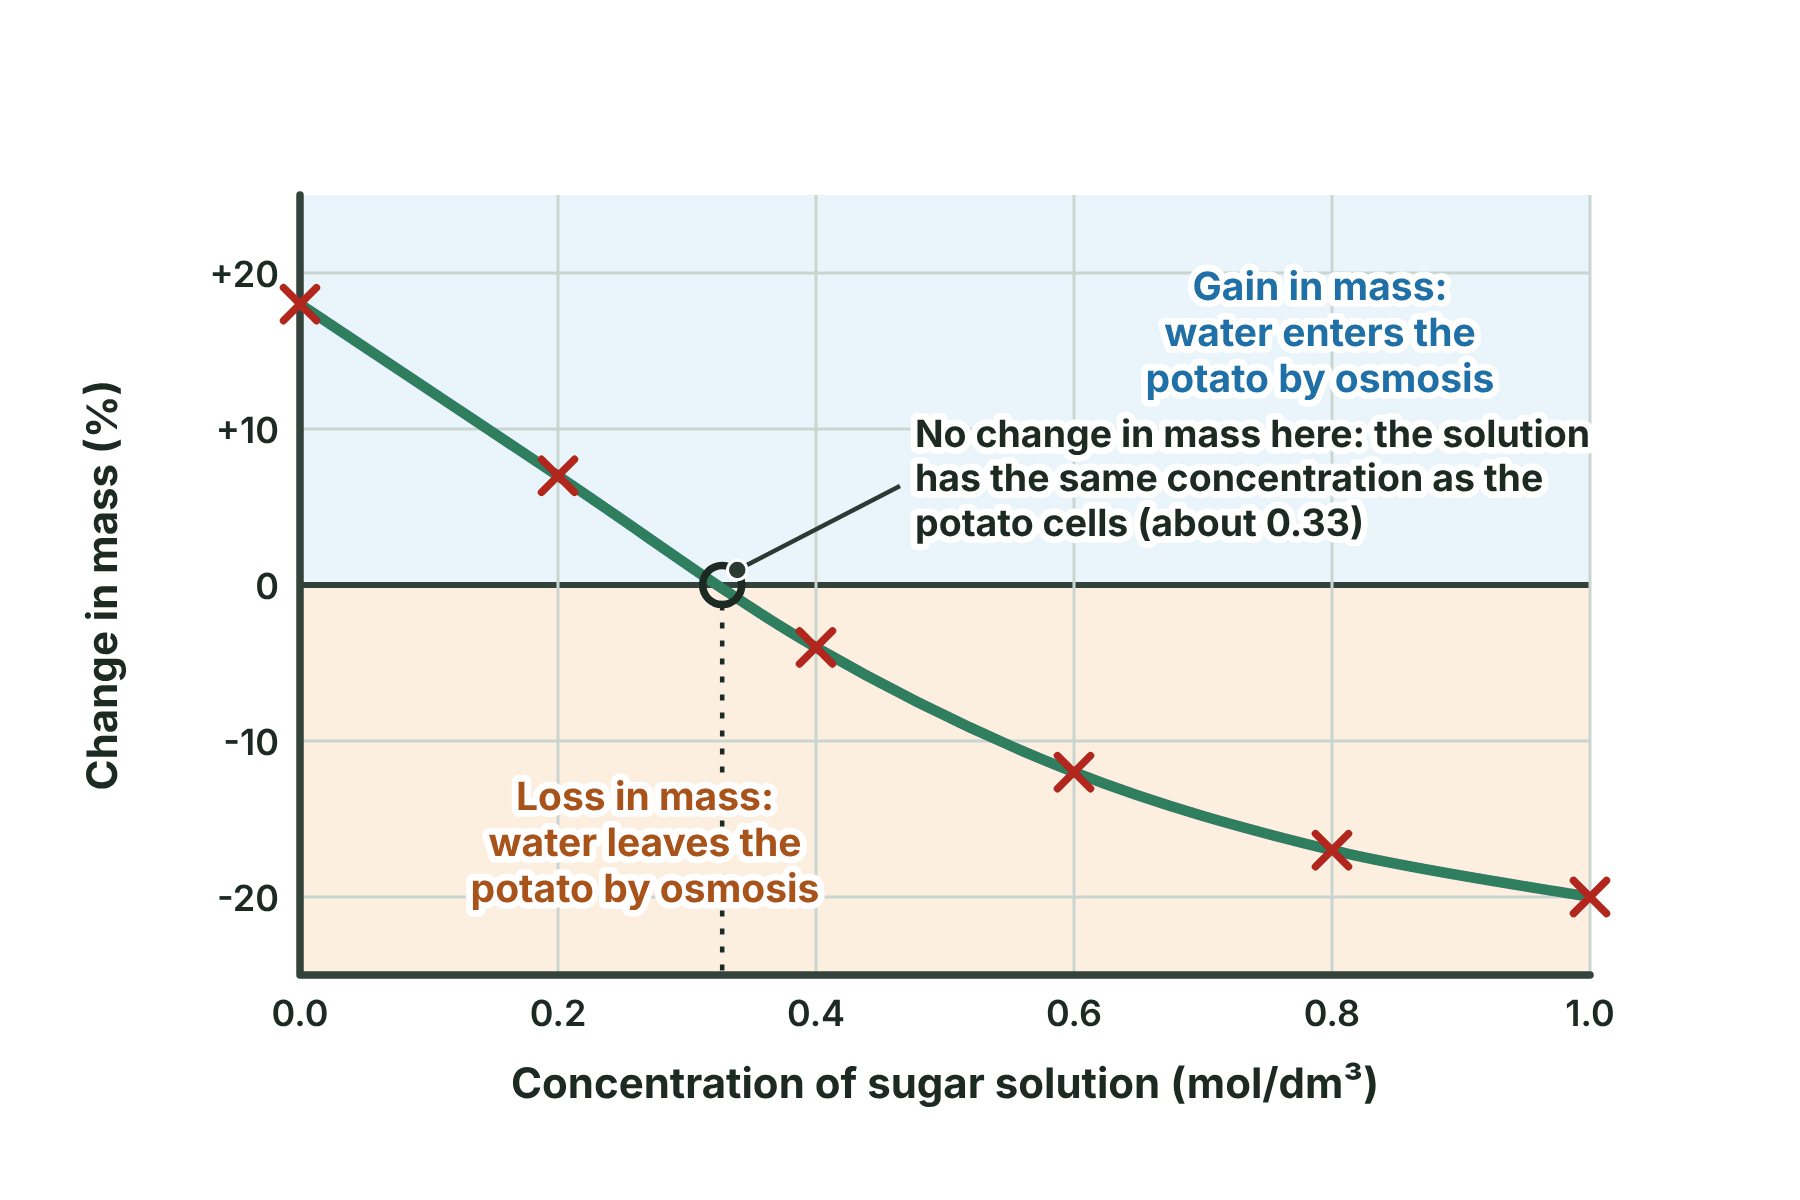
The line crosses zero at about 0.33 mol/dm³, which is the concentration of the potato cell sap.
Using the graph
Using the graph, estimate (a) the concentration of the potato cell sap and (b) the percentage change in mass in a solution of 0.5 mol/dm³.
Show the solutionHide the solution
- 1 For (a) find where the line crosses 0% That is where there is no change in mass, and it comes at about 0.33 mol/dm³ on the x-axis.
- 2 For (b) go up from 0.5 on the x-axis to the line The line at 0.5 is halfway between the points at 0.4 (−4%) and 0.6 (−12%).
- 3 Read across to the y-axis The value is about −8%, a loss of mass.
Answer(a) About 0.33 mol/dm³. (b) About −8%.
Making the investigation better
Evaluate the method by asking how reliable, accurate and safe it was.
-
Repeat and take a mean
Use several cylinders in each solution and calculate the mean percentage change. This makes the results more reliable, and a result that does not fit the pattern (an anomaly) can be spotted.
-
More concentrations
Use extra solutions close to the point where the line crosses zero, for example between 0.2 and 0.4 mol/dm³, to find the concentration of the cell sap more accurately.
-
Measure carefully
A balance that reads to two decimal places gives a more precise result. Blot every cylinder in the same way, because leftover liquid on the surface adds mass.
-
Stay safe
Cut the potato on a tile with a sharp cork borer or knife, cutting away from your hands. Wipe up any spills so that nobody slips.
The key reading
Where the line on the graph crosses zero, the solution has the same concentration as the potato cells.
No change in mass means no net movement of water.
Osmosis practical
Osmosis practical
-
Method
- identical potato cylinders
- weigh
- solutions
- same time
- blot dry
- reweigh
-
Variables
- independent: concentration
- dependent: % change
- control: size, volume, time, temperature
-
Calculation
- (final − start) ÷ start × 100
-
Graph
- above zero gain
- below zero loss
- crosses zero at no change
-
Improvements
- repeat
- mean
- more concentrations
- precise balance
Summary and exam focus
- Potato cylinders are weighed, left in sugar solutions of different concentrations, then dried and weighed again.
- Percentage change in mass = (final mass − start mass) ÷ start mass × 100.
- A gain in mass shows water entered the potato by osmosis. A loss shows water left it.
- Where the graph line crosses zero, the solution matches the concentration of the potato cell sap.
- Repeating the test and calculating a mean makes the results more reliable.
Exam focus
Describe how you would investigate the effect of sugar concentration on the mass of potato cylinders. (6 marks) (6 marks)
Put the steps in order, say what you measure and name the variables you keep the same. Always blot the cylinders dry before weighing, and always give percentage change, not just change in mass.
Key terms
The words this lesson expects you to use. Each one is linked from the first place it appears above.
- Independent variable
- The variable that is deliberately changed in an investigation.
- Dependent variable
- The variable that is measured in an investigation.
- Control variable
- A variable that is kept the same so that the test is fair.
- Percentage change
- The change in a value divided by the starting value, multiplied by 100.
- Cork borer
- A metal tube with a sharp edge used to cut cylinders of equal width from potato.
- Anomalous result
- A result that does not fit the pattern of the other results.
- Reliable
- Giving similar results when the investigation is repeated.
- Mean
- The sum of the values divided by the number of values.
- Cell sap
- The solution inside the vacuole of a plant cell.
- Isotonic
- Having the same concentration as the solution inside the cells, so there is no net movement of water.
Questions and answers
20 questions set on this lesson, with the mark schemes and model answers open.
State two variables that should be controlled in the investigation.
Mark scheme — 2 marks available
- Size / length of cylinder — 1 mark
- Volume of solution — 1 mark
- Time in solution — 1 mark
- Temperature / type of potato — 1 mark
Model answer
Any two from: the length (and width) of the potato cylinders; the volume of the solutions; the time the cylinders are left in the solutions; the temperature; the type of potato.
Explain why the potato cylinders are blotted dry before their final mass is measured.
Mark scheme — 2 marks available
- To remove liquid from the surface — 1 mark
- Because it would add extra mass / give an inaccurate result — 1 mark
Model answer
To remove solution from the surface of the cylinder. Any left on the surface would add mass, so the result would not be due only to osmosis.
A potato cylinder has a mass of 2.50 g at the start and 2.85 g at the end. Calculate the percentage change in mass.
Mark scheme — 2 marks available
- 0.35 ÷ 2.50 — 1 mark
- +14 (%) — 1 mark
Model answer
(2.85 − 2.50) ÷ 2.50 × 100 = +14%.
A potato cylinder has a mass of 3.20 g at the start and 2.72 g at the end. Calculate the percentage change in mass.
Mark scheme — 3 marks available
- Change = −0.48 g — 1 mark
- −0.48 ÷ 3.20 × 100 — 1 mark
- −15 (%) — 1 mark
Model answer
(2.72 − 3.20) ÷ 3.20 × 100 = −15%.
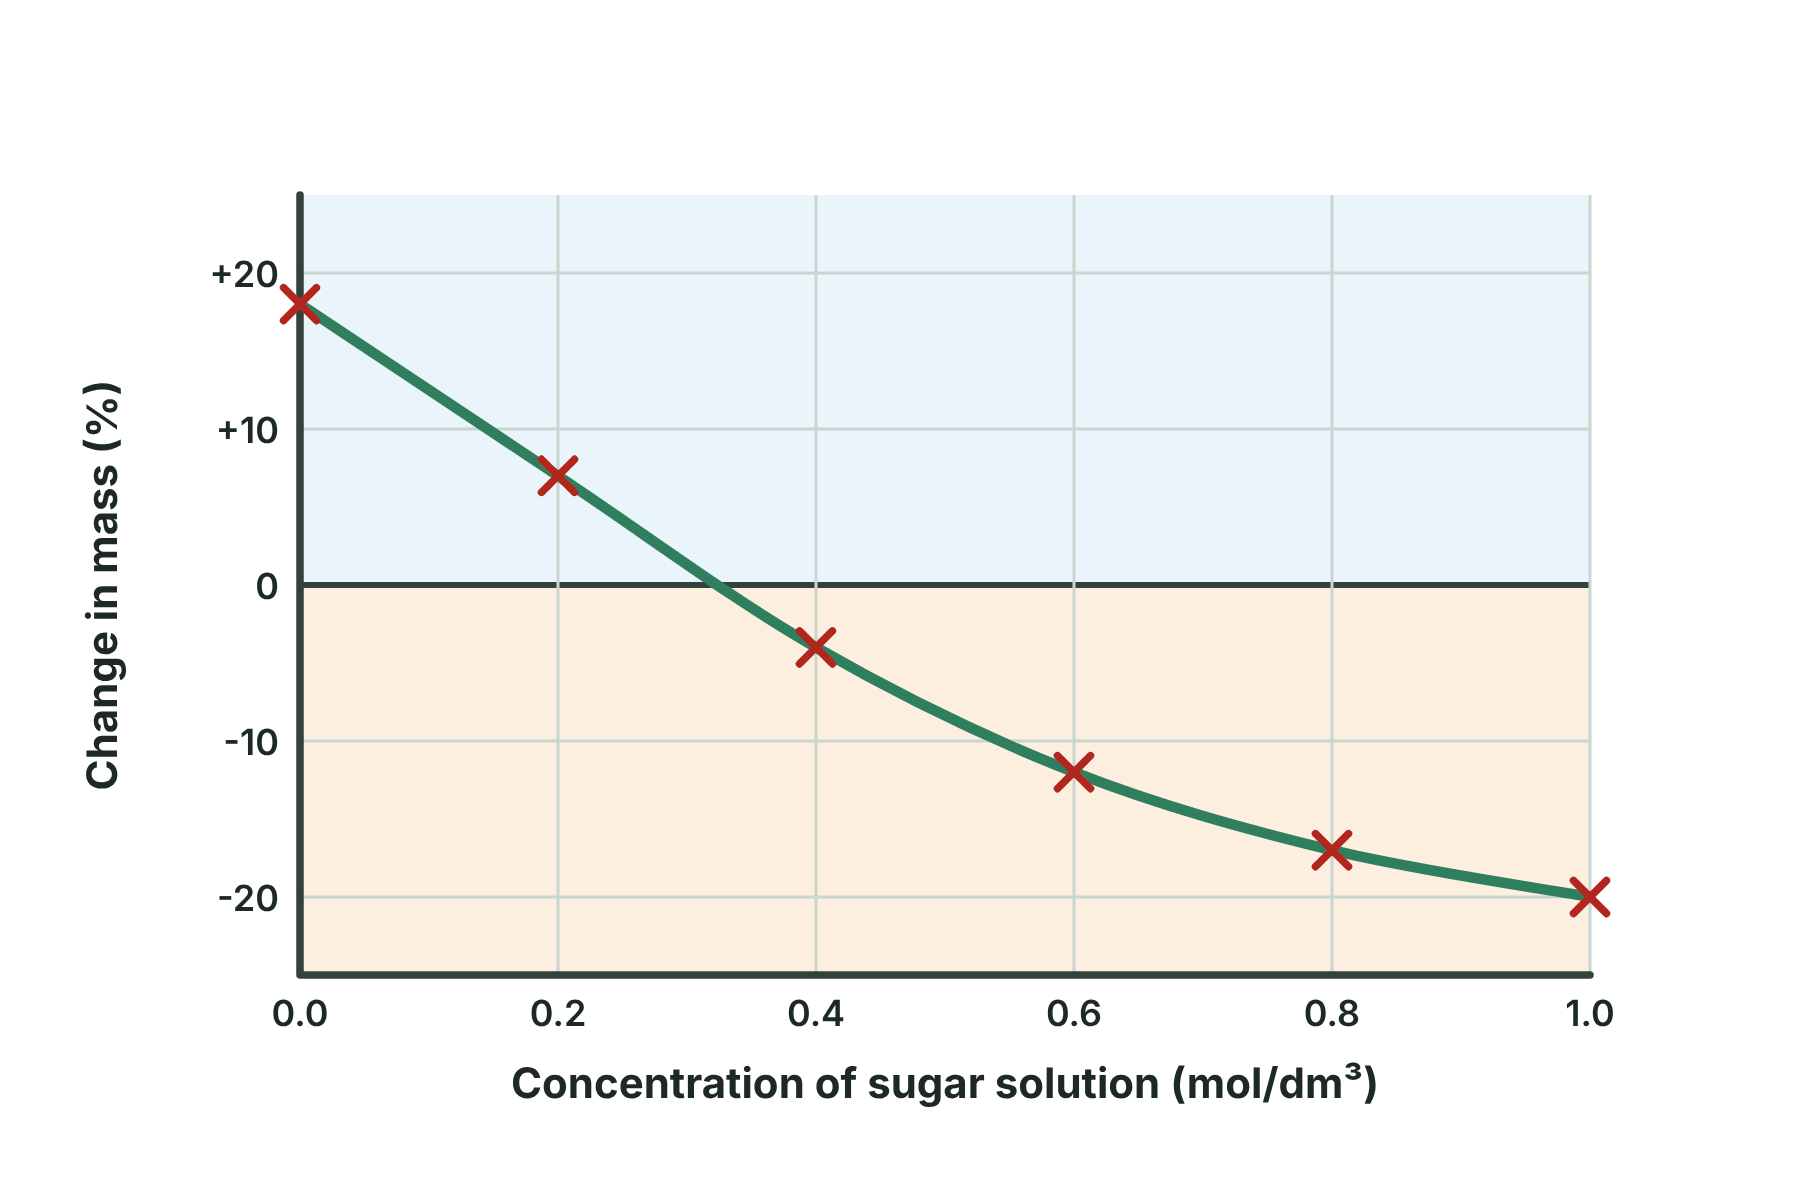
Figure 1 shows the results of an investigation into the effect of sugar concentration on potato cylinders. Estimate the concentration at which there is no change in mass, and explain what this tells you.
Mark scheme — 3 marks available
- 0.30 to 0.35 mol/dm³ — 1 mark
- Same concentration as the potato cells — 1 mark
- So no net movement of water by osmosis — 1 mark
Model answer
About 0.33 mol/dm³ (accept 0.30 to 0.35), where the line crosses 0% change. At this concentration the solution is the same as the concentration of the potato cells, so there is no net movement of water.
Use Figure 1 to give the percentage change in mass in the solution of concentration 0.6 mol/dm³, and say what this shows about the movement of water.
Mark scheme — 2 marks available
- −12% — 1 mark
- Water left the potato (by osmosis) — 1 mark
Model answer
−12% (accept −11 to −13). A loss of mass shows that water moved out of the potato by osmosis.
The potato cylinders in the most concentrated solutions lost mass. Explain why.
Mark scheme — 2 marks available
- Solution more concentrated than the potato cell sap — 1 mark
- Water left the cells by osmosis — 1 mark
Model answer
The solution was more concentrated than the cell sap in the potato. Water moved out of the potato cells into the solution by osmosis, so the mass fell.
A student calculates the percentage change in mass for each cylinder instead of just the change in mass. Explain why.
Mark scheme — 2 marks available
- Cylinders have different starting masses — 1 mark
- Percentage change allows a fair comparison — 1 mark
Model answer
The cylinders do not all start with exactly the same mass, so a percentage of the starting mass allows a fair comparison.
Suggest two ways in which the student could make the results more reliable.
Mark scheme — 2 marks available
- Repeat and calculate a mean — 1 mark
- Spot and deal with any anomalous results / control variables carefully — 1 mark
Model answer
Repeat the investigation with several cylinders in each solution and calculate a mean; check for anomalous results; keep the control variables the same each time.
Describe how you would carry out an investigation into the effect of sugar concentration on the mass of potato cylinders.
What the examiner wants: Include what you would measure, what you would keep the same, and how you would process the results.
Mark scheme — 6 marks available
- Cut identical cylinders of potato — 1 mark
- Measure the starting mass — 1 mark
- Same volume of different concentrations of solution — 1 mark
- Same time (and temperature) in the solutions — 1 mark
- Blot dry and measure the final mass — 1 mark
- Calculate the percentage change / repeat and take a mean — 1 mark
Model answer
Cut cylinders of potato of the same length with a cork borer. Measure the mass of each cylinder. Put the same volume of different concentrations of sugar solution into test tubes, including pure water. Put one cylinder in each tube and leave them for the same length of time at the same temperature. Take the cylinders out, blot them dry and measure the mass of each again. Calculate the percentage change in mass for each, and repeat the investigation to calculate a mean.
What is the independent variable in the potato investigation?
Why: The independent variable is the one you change: the concentration of the solution.
What is the dependent variable?
Why: The dependent variable is what you measure: the percentage change in mass of the potato.
A potato cylinder gains mass in a solution. What does this show?
Why: The potato gained water by osmosis, so the solution was more dilute than the potato cell sap.
A cylinder goes from 2.00 g to 1.80 g. What is the percentage change in mass?
Why: The change is −0.20 g. Dividing by the start mass gives −0.1, so the change is −10%.
Why is the surface of each cylinder blotted dry?
Why: Solution left on the surface would add mass and affect the result.
On the graph, where does the line cross zero change?
Why: This is the concentration at which the solution matches the potato cell sap, so there is no net movement of water.
Which would make the results more reliable?
Why: Repeating the test and calculating a mean reduces the effect of random errors and anomalies.
Which of these is a control variable?
Why: The volume of the solution has to be the same in every tube. The concentration is what is changed, and the mass is what is measured.
Why is pure water used as one of the solutions?
Why: Pure water is the most dilute solution, so it shows the biggest gain in mass, and gives a zero point on the concentration scale.
A student finds the line crosses zero at 0.3 mol/dm³ and wants a more accurate value. What should they do?
Why: Using more solutions close to 0.3, such as 0.25, 0.30 and 0.35 mol/dm³, narrows down where the line crosses zero.