Exam questions · Maths · Statistics
Pie Charts, Bar Charts and Stem-and-Leaf Diagrams
- 6 exam questions
- 20 marks
- 9 quick checks
-
1 Calculate [3 marks]
45 students are asked how they travel to school. 18 walk, 15 take the bus, 9 cycle and 3 come by car. Calculate the angle for each type of travel in a pie chart. [3 marks]
Show answerHide answer
Model answer
Each student is \(\dfrac{360}{45} = 8^\circ\). Walk: \(18 \times 8 = 144^\circ\). Bus: \(15 \times 8 = 120^\circ\). Cycle: \(9 \times 8 = 72^\circ\). Car: \(3 \times 8 = 24^\circ\).
Mark scheme
- \(360 \div 45 = 8\) — M1
- At least two angles correct — A1
- \(144^\circ, 120^\circ, 72^\circ, 24^\circ\) — A1
-
2 Calculate [5 marks]
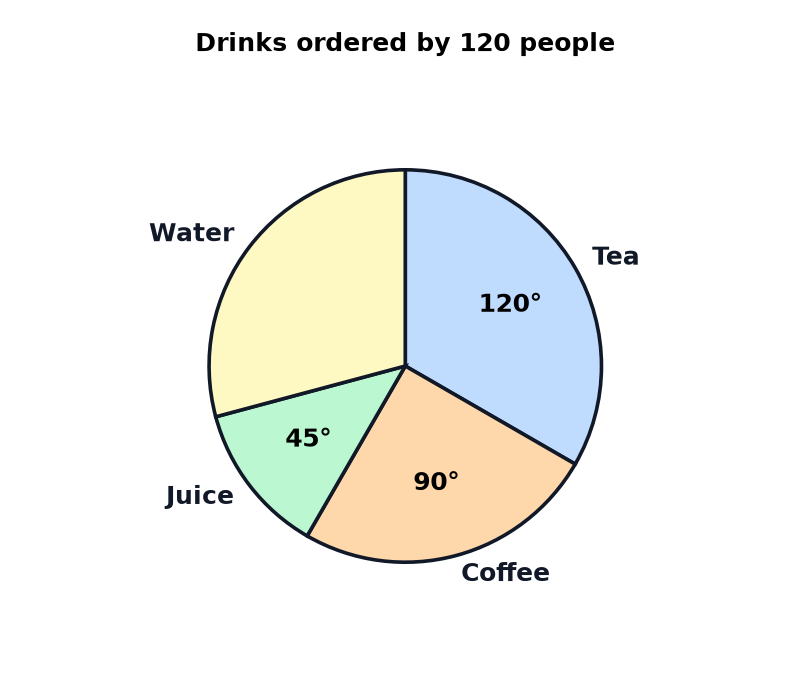
The pie chart shows the drinks ordered by 120 people in a cafe. The angle for water is not shown. (a) Calculate the number of people who ordered tea. [2 marks] (b) Calculate the angle for water. [1 mark] (c) Calculate the number of people who ordered water. [1 mark] (d) Write the sector for juice as a percentage of the whole pie chart. [1 mark]
Show answerHide answer
Model answer
(a) Each person is \(\dfrac{360}{120} = 3^\circ\), so tea is \(\dfrac{120}{3} = 40\). (b) \(360 - 120 - 90 - 45 = 105^\circ\). (c) \(\dfrac{105}{3} = 35\). (d) \(\dfrac{45}{360} = 12.5\%\).
Mark scheme
- (a) \(\dfrac{120}{360} \times 120\) or \(120 \div 3\) — M1
- (a) 40 — A1
- (b) \(105^\circ\) — B1
- (c) 35 — B1
- (d) 12.5% — B1
-
3 Find [4 marks]
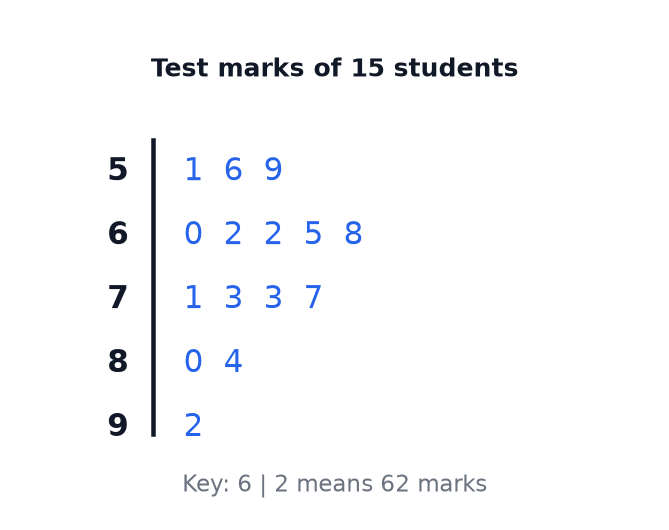
The stem-and-leaf diagram shows the marks of 15 students in a test. (a) How many students scored more than 70 marks? [1 mark] (b) Find the median mark. [1 mark] (c) Find the range. [1 mark] (d) Write down the modes. [1 mark]
Show answerHide answer
Model answer
(a) The marks above 70 are 71, 73, 73, 77, 80, 84 and 92, which is 7 students. (b) There are 15 values, so the median is the 8th value, 68. (c) \(92 - 51 = 41\). (d) 62 and 73 each occur twice.
Mark scheme
- (a) 7 — B1
- (b) 68 — B1
- (c) 41 — B1
- (d) 62 and 73 — B1
-
4 Explain [2 marks]
A graph has bars of different widths, and the horizontal scale jumps from 0 to 50 with no break shown. Give two reasons why the graph may be misleading. [2 marks]
Show answerHide answer
Model answer
Bars of different widths make the heights hard to compare, and the scale that jumps without a break gives a false impression of the sizes of the values.
Mark scheme
- The bars have different widths — B1
- The scale is uneven or has a jump — B1
-
5 Find [3 marks]
A stem-and-leaf diagram shows the times, in minutes, of 10 runners. The stem 1 has leaves 3, 6 and 8. The stem 2 has leaves 0, 2, 2, 5 and 9. The stem 3 has leaves 1 and 4. The key says that 2 bar 0 means 20 minutes. (a) Write down the number of runners with a time of more than 25 minutes. [1 mark] (b) Find the median time. [2 marks]
Show answerHide answer
Model answer
(a) The times above 25 are 29, 31 and 34, so 3 runners. (b) In order: 13, 16, 18, 20, 22, 22, 25, 29, 31, 34. The 5th and 6th values are both 22, so the median is 22 minutes.
Mark scheme
- (a) 3 — B1
- (b) The 5th and 6th values identified — M1
- (b) 22 — A1
-
6 Calculate [3 marks]
Pie chart A shows the travel of 60 people. The angle for tea is \(120^\circ\). Pie chart B shows the travel of 90 people. The angle for tea is \(100^\circ\). Compare the number of people who have tea in the two charts, and the proportion. [3 marks]
Show answerHide answer
Model answer
Chart A: \(\dfrac{120}{360} \times 60 = 20\) people, which is \(\dfrac{1}{3}\) of the people. Chart B: \(\dfrac{100}{360} \times 90 = 25\) people, which is \(\dfrac{5}{18}\) of the people. More people have tea in chart B, but a bigger proportion of the people have tea in chart A.
Mark scheme
- \(\dfrac{120}{360} \times 60 = 20\) and \(\dfrac{100}{360} \times 90 = 25\) — M1
- A comparison of the numbers, 25 and 20 — A1
- A comparison of the proportions, with a conclusion — A1
Quick check
-
1
60 students choose a sport. 24 choose football. What is the angle for football on a pie chart?
Show answerHide answer
C: \(144^\circ\)
Each student is \(\dfrac{360}{60} = 6^\circ\), so \(24 \times 6 = 144^\circ\).
-
2
A pie chart shows 40 people. How many degrees represent each person?
Show answerHide answer
B: \(9^\circ\)
\(\dfrac{360}{40} = 9\).
-
3
A pie chart shows 36 people. A sector is \(100^\circ\). How many people does it represent?
Show answerHide answer
A: \(10\)
\(\dfrac{100}{360} \times 36 = 10\).
-
4
What fraction of a pie chart is a \(90^\circ\) sector?
Show answerHide answer
D: \(\dfrac{1}{4}\)
\(\dfrac{90}{360} = \dfrac{1}{4}\).
-
5
What must every stem-and-leaf diagram have?
Show answerHide answer
C: A key
Without a key the values cannot be read.
-
6
A stem-and-leaf diagram has 14 ordered values. The 7th is 26 and the 8th is 29. What is the median?
Show answerHide answer
B: \(27.5\)
\(\dfrac{26 + 29}{2} = 27.5\).
-
7
The values in a stem-and-leaf diagram run from 12 to 45. What is the range?
Show answerHide answer
A: \(33\)
\(45 - 12 = 33\).
-
8
Which of these makes a bar chart misleading?
Show answerHide answer
D: The vertical scale does not start at zero
A scale that does not start at zero exaggerates differences.
-
9
On a pie chart for 60 people, a sector is \(54^\circ\). What percentage is that?
Show answerHide answer
C: \(15\%\)
\(\dfrac{54}{360} = 0.15\).