2.5 Required practical: I-V characteristics
Required practical: investigate the I-V characteristics of a resistor, a filament lamp and a diode, including the circuit, method, results and precautions.
Aim
To investigate how the current through a fixed resistor, a filament lamp and a diode changes with the potential difference across each of them, and to plot their I-V characteristics.
Key terms
- Independent variable: the variable you change. Here it is the potential difference across the component.
- Dependent variable: the variable you measure. Here it is the current through the component.
- Control variable: a variable you keep the same to make the test fair, such as the temperature of the component.
- Protective resistor: a resistor placed in series with a component to limit the current and stop it being damaged.
Apparatus
- power supply (d.c.)
- variable resistor
- ammeter
- voltmeter
- the component to be tested (fixed resistor, filament lamp or diode)
- switch and connecting wires
The circuit
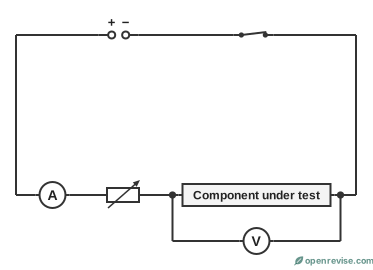
The ammeter is in series with the component. The voltmeter is in parallel across the component only. The variable resistor changes the potential difference across the component and the current through it.
Method
- Set up the circuit as shown, with the fixed resistor as the component. Make sure the voltmeter is across the component only.
- Close the switch. Adjust the variable resistor to give a low potential difference. Record the potential difference and the current.
- Change the variable resistor to increase the potential difference in steps. Record the current each time. Take at least six pairs of readings.
- Switch off between readings, to stop the component getting hot.
- Reverse the connections to the power supply (or reverse the component) and repeat to get negative readings.
- Repeat the whole experiment for the filament lamp and for the diode. Put a protective resistor in series with the diode.
Results and graph
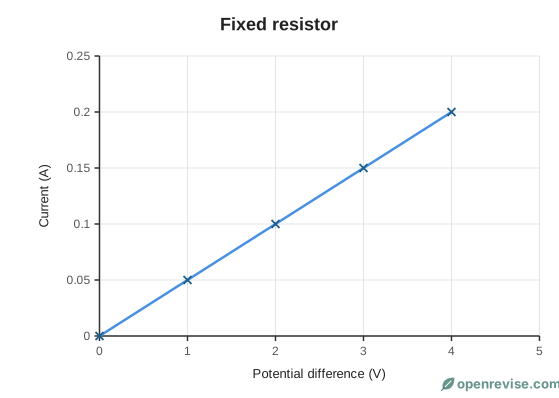
Record your results in a table. The resistance is worked out as R = \frac{V}{I}.
| Potential difference (V) | Current (A) | Resistance (Ω) |
|---|---|---|
| 0.0 | 0.00 | - |
| 1.0 | 0.05 | 20 |
| 2.0 | 0.10 | 20 |
| 3.0 | 0.15 | 20 |
| 4.0 | 0.20 | 20 |
Plot current (y-axis) against potential difference (x-axis) for each component. Draw a straight line of best fit through the origin for the resistor, and a smooth curve for the lamp and the diode.
Precautions and sources of error
- Keep the currents small and switch off between readings. If the component heats up, its resistance changes and the results are not valid.
- The diode has a very low resistance in the forward direction, so a protective resistor stops too large a current damaging it.
- Check the meters for zero errors before you start.
- A filament lamp gets hot. Do not touch it, and do not go above its rated potential difference.
Analysing the results
For each pair of readings, calculate the resistance using R = \frac{V}{I}, and plot a graph of current (y-axis) against potential difference (x-axis). Describe the shape of each graph and say what it shows.
- Fixed resistor: a straight line through the origin, so the current is directly proportional to the potential difference and the resistance is constant (at constant temperature).
- Filament lamp: a curve that flattens out. The resistance rises as the filament heats up.
- Diode: almost no current until the forward p.d. is about 0.6 V, and then the current rises very quickly. Almost no current in the reverse direction.
| Potential difference (V) | Current (mA) |
|---|---|
| 0.0 | 0.0 |
| 0.3 | 0.0 |
| 0.5 | 0.1 |
| 0.6 | 1.5 |
| 0.7 | 12 |
| 0.8 | 55 |
Notice that the current changes most quickly between 0.5 V and 0.8 V. This is where the student should take more readings, in smaller steps, to show the shape of the curve. Fewer readings are needed where the current is close to zero.
Dealing with anomalous results
If one point is clearly off the pattern, it is an anomaly. Check the readings and repeat that measurement. If it was a mistake, such as a misread meter, the result can be ignored. If it is a real result, you must keep it.
Evaluating the method
- Heating: if the current is left on, the component heats up and its resistance changes. Switch off between readings, or only use the current briefly.
- Zero errors: check that the meters read zero before the circuit is switched on.
- Range of readings: a wider range (including reversed readings) gives a more complete graph.
- Reliability: repeat the experiment and compare the graphs.
- Variable power supply: a power supply with a variable output could be used in place of the variable resistor to change the potential difference more smoothly.
Planning questions
If you are asked to plan this experiment, include: the circuit (with the ammeter in series and the voltmeter in parallel across the component only), the variable you change (the potential difference, using the variable resistor), the variable you measure (the current), at least five or six readings, reversing the connections, and a graph of current against potential difference.
Test yourself on this lesson
9 exam questions · 20 marks · with mark schemes and model answers
Found a mistake?