1.8 Required practical: thermal insulation
How to compare the insulating properties of different materials by measuring cooling curves, with variables, safety, results and evaluation (AQA required practical 2, OCR PAG P5).
Aim
To investigate how the thickness or material of an insulator affects the rate of cooling of hot water. This is AQA required practical 2 and OCR practical activity group P5.
Key terms
- Independent variable: the variable you change.
- Dependent variable: the variable you measure.
- Control variable: a variable you keep the same so that the test is fair.
- Rate of cooling: how quickly the temperature of an object falls, found from the gradient of a temperature-time graph.
Apparatus
- several identical beakers or metal cans, with lids;
- different insulating materials (for example bubble wrap, cotton wool, felt, newspaper) or different thicknesses of one material;
- a kettle and hot water;
- thermometers (or temperature sensors and a datalogger);
- a stopwatch;
- a measuring cylinder.
Method
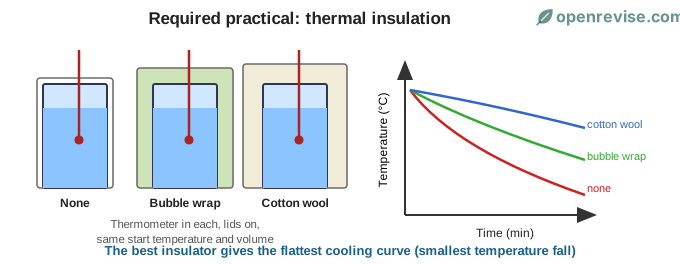
- Wrap each beaker in a different insulator. Leave one beaker with no insulation to use as the control.
- Heat water in a kettle. Use the measuring cylinder to pour the same volume of hot water into each beaker. Put a lid on each beaker.
- Place a thermometer through the lid of each beaker and record the starting temperature.
- Start the stopwatch. Record the temperature of the water every minute for 10 to 15 minutes.
- Repeat the experiment to check your results.
Variables
- Independent variable: the type or thickness of insulator.
- Dependent variable: the temperature of the water at each time (or the temperature fall).
- Control variables: the starting temperature, the volume of water, the type and size of beaker, the lid, the room temperature, and (when comparing materials) the thickness of the insulator.
Results
Plot a graph of temperature (y-axis) against time (x-axis) for each insulator. The better the insulator, the more slowly the temperature falls, so the curve is flatter. The rate of cooling at any time is the gradient of the curve. The graph is steepest at the start, when the temperature difference between the water and the room is greatest.
Safety
- Hot water can scald. Pour carefully and keep the beakers on a stable surface away from the edge of the bench.
- Clear up spills straight away so nobody slips.
- Do not hold a glass thermometer as you pour.
Evaluation
- Using the same start temperature is important, because the rate of cooling depends on the temperature difference.
- Heat can be lost through the top of the beaker, so every beaker needs a lid.
- Repeating the readings and finding a mean improves reliability.
- Make sure each insulator is the same thickness if you are comparing materials, otherwise the test is not fair.
Example results
| Time (min) | No insulation | Bubble wrap | Felt |
|---|---|---|---|
| 0 | 85 | 85 | 85 |
| 2 | 78 | 80 | 82 |
| 4 | 72 | 76 | 80 |
| 6 | 67 | 72 | 78 |
| 8 | 63 | 69 | 76 |
| 10 | 60 | 66 | 74 |
Calculating the rate of cooling
\text{rate of cooling} = \frac{\text{temperature fall}}{\text{time taken}}
- No insulation: \frac{85 - 60}{10} = 2.5 °C per minute.
- Felt: \frac{85 - 74}{10} = 1.1 °C per minute.
The water in the beaker with felt cooled \frac{2.5}{1.1} = 2.3 times more slowly, so the felt is a better insulator than bubble wrap (whose rate is \frac{85 - 66}{10} = 1.9 °C per minute).
The rate of cooling is not constant. It is greatest at the start, because the temperature difference between the water and the room is biggest, and it falls as the water cools. So the cooling curve gets less steep.
Analysing the results
- Compare the temperature fall in the same time, or the time taken to fall by the same amount.
- Compare the gradients of the graphs at the same temperature (Higher tier: draw a tangent to the curve).
- If one point is clearly off the curve (an anomaly), repeat that measurement, and do not include a result that you cannot explain in a mean.
Improving the investigation
- Use a temperature sensor and a data logger to record the temperature continuously. This gives many more readings and avoids errors when reading a thermometer.
- Use the same thickness of each insulator, or the comparison is not fair.
- Use a thermometer with a resolution of 0.5 °C or better.
- Repeat the experiment at least three times and calculate a mean.
- Use a lid, stir gently before each reading so the temperature of the water is even, and keep the beakers away from draughts.
Link to buildings
The results show that thick layers of materials that trap air (such as felt, wool and fibreglass) are the best insulators. This is why they are used in loft insulation and in clothes.
Test yourself on this lesson
9 exam questions · 18 marks · with mark schemes and model answers
Found a mistake?