Exam questions · Maths
Statistics
- 30 exam questions
- 97 marks
- 45 quick checks
Averages and Range
Just this lesson-
1 Work out [3 marks]
Here are the ages, in years, of seven children: 14, 11, 15, 11, 13, 17, 11. Work out (a) the mode, (b) the median, (c) the range. [3 marks]
Show answerHide answer
Model answer
(a) 11 appears three times, so the mode is 11. (b) In order: 11, 11, 11, 13, 14, 15, 17, so the median is 13. (c) \(17 - 11 = 6\).
Mark scheme
- (a) 11 — B1
- (b) 13 — B1
- (c) 6 — B1
-
2 Work out [6 marks]
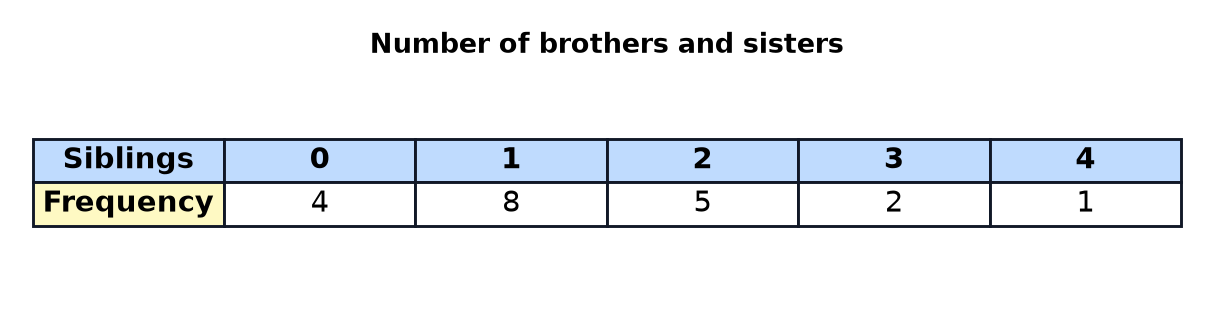
The table shows the number of brothers and sisters that each of 20 pupils has. (a) Write down the mode. [1 mark] (b) Work out the mean. [3 marks] (c) Work out the median. [2 marks]
Show answerHide answer
Model answer
(a) The highest frequency is 8, so the mode is 1. (b) \(0 \times 4 + 1 \times 8 + 2 \times 5 + 3 \times 2 + 4 \times 1 = 0 + 8 + 10 + 6 + 4 = 28\). The mean is \(\dfrac{28}{20} = 1.4\). (c) The cumulative frequencies are 4, 12, 17, 19, 20, so the 10th and 11th values are both 1. The median is 1.
Mark scheme
- (a) 1 — B1
- (b) Products \(f \times x\) with at least 4 correct — M1
- (b) \(\dfrac{28}{20}\) or total 28 — M1
- (b) 1.4 — A1
- (c) Cumulative frequencies, or the 10th and 11th values — M1
- (c) 1 — A1
-
3 Compare [2 marks]
Team A scored a mean of 24 points in a game and the range was 10. Team B scored a mean of 27 points and the range was 18. Compare the points scored by the two teams. [2 marks]
Show answerHide answer
Model answer
On average Team B scored more points, with a mean of 27 compared with 24. Team A was more consistent, because its range of 10 is smaller than 18.
Mark scheme
- A comparison of the means, in context — Q1
- A comparison of the ranges, in context — Q1
-
4 Work out [3 marks]
The mean of six numbers is 9. Five of the numbers are 4, 8, 10, 11 and 13. Work out the sixth number. [3 marks]
Show answerHide answer
Model answer
The total of six numbers is \(6 \times 9 = 54\). The five known numbers add up to \(4 + 8 + 10 + 11 + 13 = 46\). The sixth number is \(54 - 46 = 8\).
Mark scheme
- \(6 \times 9 = 54\) — M1
- \(54 - 46\) — M1
- 8 — A1
-
5 Work out [4 marks]
The table shows the heights of 40 plants. For the classes \(0 < h \leq 10\), \(10 < h \leq 20\), \(20 < h \leq 30\) and \(30 < h \leq 40\) the frequencies are 6, 14, 12 and 8. (a) Write down the modal class. [1 mark] (b) Work out an estimate for the mean height. [3 marks]
Show answerHide answer
Model answer
(a) The highest frequency is 14, so the modal class is \(10 < h \leq 20\). (b) The mid-points are 5, 15, 25 and 35. \(5 \times 6 + 15 \times 14 + 25 \times 12 + 35 \times 8 = 30 + 210 + 300 + 280 = 820\). The estimate of the mean is \(\dfrac{820}{40} = 20.5\).
Mark scheme
- (a) \(10 < h \leq 20\) — B1
- (b) Mid-points 5, 15, 25, 35 used — M1
- (b) \(\dfrac{820}{40}\) or total 820 — M1
- (b) 20.5 — A1
-
6 Work out [3 marks]
The mean of 3 numbers is 5. The mean of 7 other numbers is 9. Work out the mean of all 10 numbers. [3 marks]
Show answerHide answer
Model answer
The total of the first 3 numbers is \(3 \times 5 = 15\) and of the other 7 is \(7 \times 9 = 63\). The mean of all 10 is \(\dfrac{15 + 63}{10} = \dfrac{78}{10} = 7.8\).
Mark scheme
- \(3 \times 5 = 15\) or \(7 \times 9 = 63\) — M1
- \(\dfrac{15 + 63}{10}\) — M1
- 7.8 — A1
Quick check
-
1
What is the median of 3, 5, 6, 8, 9, 12?
Show answerHide answer
B: \(7\)
With 6 values, take the mean of the 3rd and 4th: \(\dfrac{6 + 8}{2} = 7\).
-
2
What is the range of 3, 8, 11, 20?
Show answerHide answer
A: \(17\)
\(20 - 3 = 17\).
-
3
What is the mean of 4, 6, 8, 10, 12?
Show answerHide answer
D: \(8\)
\(\dfrac{40}{5} = 8\).
-
4
Which average is least affected by an outlier?
Show answerHide answer
C: The median
The median depends only on the middle value.
-
5
The numbers 0, 1, 2, 3, 4 have frequencies 4, 4, 6, 4, 2. What is the mean?
Show answerHide answer
B: \(1.8\)
\(\dfrac{0 + 4 + 12 + 12 + 8}{20} = \dfrac{36}{20} = 1.8\).
-
6
What is the mode of the numbers 0, 1, 2, 3, 4 with frequencies 4, 4, 6, 4, 2?
Show answerHide answer
A: \(2\)
The highest frequency, 6, is for the value 2.
-
7
What is the mid-point of the class \(20 < w \leq 40\)?
Show answerHide answer
D: \(30\)
\(\dfrac{20 + 40}{2} = 30\).
-
8
Classes \(0 < w \leq 20\), \(20 < w \leq 40\) and \(40 < w \leq 60\) have frequencies 5, 10 and 5. What is the estimated mean?
Show answerHide answer
C: \(30\)
Using mid-points: \(\dfrac{10 \times 5 + 30 \times 10 + 50 \times 5}{20} = \dfrac{600}{20} = 30\).
-
9
The mean of five numbers is 8. Four of them are 5, 7, 9 and 10. What is the fifth?
Show answerHide answer
B: \(9\)
The total is \(5 \times 8 = 40\), and \(40 - 31 = 9\).
Pie Charts, Bar Charts and Stem-and-Leaf Diagrams
Just this lesson-
1 Work out [3 marks]
Some children are asked their favourite colour. 9 choose blue, 6 choose red, 5 choose green and 4 choose yellow. The results are shown in a pie chart. Work out the angle for each colour. [3 marks]
Show answerHide answer
Model answer
There are 24 children, so each child is \(\dfrac{360}{24} = 15^\circ\). Blue: \(9 \times 15 = 135^\circ\). Red: \(6 \times 15 = 90^\circ\). Green: \(5 \times 15 = 75^\circ\). Yellow: \(4 \times 15 = 60^\circ\).
Mark scheme
- \(24\) children and \(360 \div 24 = 15\) — M1
- At least two angles correct — A1
- \(135^\circ, 90^\circ, 75^\circ, 60^\circ\) — A1
-
2 Work out [5 marks]
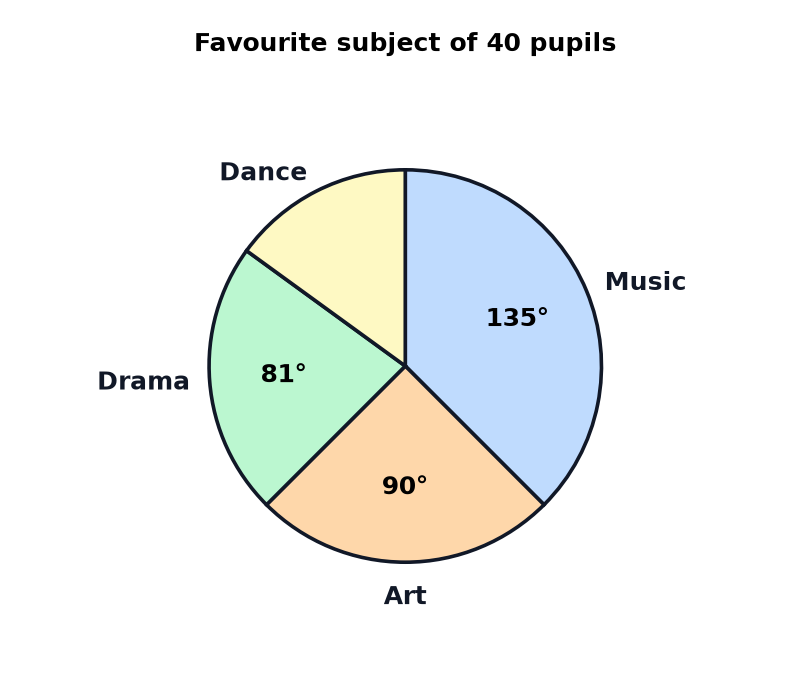
The pie chart shows the favourite subjects of 40 pupils. The angle for dance is not shown. (a) How many pupils chose music? [2 marks] (b) Work out the angle for dance. [1 mark] (c) How many pupils chose dance? [1 mark] (d) What fraction of the pupils chose art? Give your answer in its simplest form. [1 mark]
Show answerHide answer
Model answer
(a) Each pupil is \(\dfrac{360}{40} = 9^\circ\), so \(\dfrac{135}{9} = 15\) pupils. (b) \(360 - 135 - 90 - 81 = 54^\circ\). (c) \(\dfrac{54}{9} = 6\). (d) \(\dfrac{90}{360} = \dfrac{1}{4}\).
Mark scheme
- (a) \(\dfrac{135}{360} \times 40\) or \(135 \div 9\) — M1
- (a) 15 — A1
- (b) \(54^\circ\) — B1
- (c) 6 — B1
- (d) \(\dfrac{1}{4}\) — B1
-
3 Work out [4 marks]
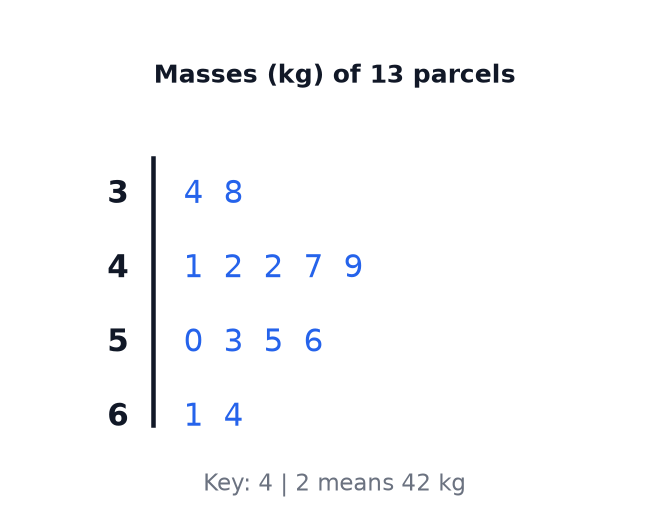
The stem-and-leaf diagram shows the masses of 13 parcels. (a) Write down the mode. [1 mark] (b) Work out the median. [2 marks] (c) Work out the range. [1 mark]
Show answerHide answer
Model answer
(a) 42 occurs twice. (b) There are 13 values, so the median is the 7th value, which is 49 kg. (c) \(64 - 34 = 30\) kg.
Mark scheme
- (a) 42 — B1
- (b) The 7th value identified — M1
- (b) 49 — A1
- (c) 30 — B1
-
4 Explain [2 marks]
Give a reason why each of these charts may be misleading. (a) A pie chart with a 3D effect. [1 mark] (b) A bar chart where the vertical scale starts at 50 instead of 0. [1 mark]
Show answerHide answer
Model answer
(a) The 3D effect distorts the sizes of the sectors, so they are hard to compare. (b) A small difference between the bars looks much bigger than it really is.
Mark scheme
- (a) Distorts the sizes of the sectors — B1
- (b) Exaggerates the differences between the bars — B1
-
5 Work out [3 marks]
The stem-and-leaf diagram shows the heights of some plants. The stem 4 has leaves 1, 3 and 7. The stem 5 has leaves 0, 2, 2 and 8. The stem 6 has leaves 3 and 5. The key says that 4 bar 1 means 41 cm. Work out (a) the mode, (b) the median, (c) the range. [3 marks]
Show answerHide answer
Model answer
(a) 52 occurs twice. (b) There are 9 values, so the median is the 5th value, 52 cm. (c) \(65 - 41 = 24\) cm.
Mark scheme
- (a) 52 — B1
- (b) 52 — B1
- (c) 24 — B1
-
6 Work out [3 marks]
A pie chart shows the favourite pets of 72 people. The angle for cats is \(160^\circ\) and the angle for dogs is \(120^\circ\). (a) Work out the number of people who chose cats. [2 marks] (b) How many more people chose cats than dogs? [1 mark]
Show answerHide answer
Model answer
(a) Each person is \(\dfrac{360}{72} = 5^\circ\), so cats is \(\dfrac{160}{5} = 32\). (b) Dogs is \(\dfrac{120}{5} = 24\), so \(32 - 24 = 8\) more chose cats.
Mark scheme
- (a) \(360 \div 72 = 5\) or \(\dfrac{160}{360} \times 72\) — M1
- (a) 32 — A1
- (b) 8 — B1
Quick check
-
1
60 students choose a sport. 24 choose football. What is the angle for football on a pie chart?
Show answerHide answer
C: \(144^\circ\)
Each student is \(\dfrac{360}{60} = 6^\circ\), so \(24 \times 6 = 144^\circ\).
-
2
A pie chart shows 40 people. How many degrees represent each person?
Show answerHide answer
B: \(9^\circ\)
\(\dfrac{360}{40} = 9\).
-
3
A pie chart shows 36 people. A sector is \(100^\circ\). How many people does it represent?
Show answerHide answer
A: \(10\)
\(\dfrac{100}{360} \times 36 = 10\).
-
4
What fraction of a pie chart is a \(90^\circ\) sector?
Show answerHide answer
D: \(\dfrac{1}{4}\)
\(\dfrac{90}{360} = \dfrac{1}{4}\).
-
5
What must every stem-and-leaf diagram have?
Show answerHide answer
C: A key
Without a key the values cannot be read.
-
6
A stem-and-leaf diagram has 14 ordered values. The 7th is 26 and the 8th is 29. What is the median?
Show answerHide answer
B: \(27.5\)
\(\dfrac{26 + 29}{2} = 27.5\).
-
7
The values in a stem-and-leaf diagram run from 12 to 45. What is the range?
Show answerHide answer
A: \(33\)
\(45 - 12 = 33\).
-
8
Which of these makes a bar chart misleading?
Show answerHide answer
D: The vertical scale does not start at zero
A scale that does not start at zero exaggerates differences.
-
9
On a pie chart for 60 people, a sector is \(54^\circ\). What percentage is that?
Show answerHide answer
C: \(15\%\)
\(\dfrac{54}{360} = 0.15\).
Scatter Graphs
Just this lesson-
1 Write down [2 marks]
Write down the type of correlation between (a) the age of a car and its value, (b) the heights of children and their ages. [2 marks]
Show answerHide answer
Model answer
(a) Negative correlation. (b) Positive correlation.
Mark scheme
- (a) Negative — B1
- (b) Positive — B1
-
2 Estimate [5 marks]
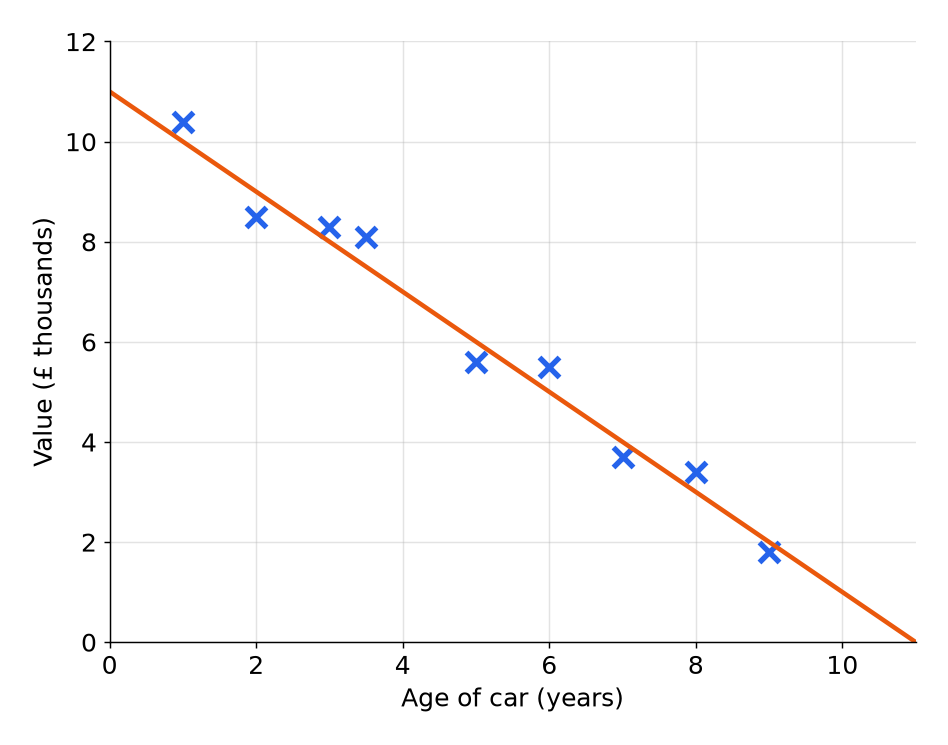
The scatter graph shows the age and the value of some cars. A line of best fit is drawn. (a) Describe the relationship between the age of a car and its value. [1 mark] (b) Use the line of best fit to estimate the value of a car that is 4 years old. [2 marks] (c) Dev says that the line can be used to estimate the value of a car that is 12 years old. Explain why this is not sensible. [2 marks]
Show answerHide answer
Model answer
(a) As the age of a car increases, its value decreases. (b) Going up from 4 years to the line and across gives about 7, which is \(\pounds 7000\). (c) 12 years is outside the range of the data. The line would give a negative value, \(11 - 12 = -1\), which is impossible.
Mark scheme
- (a) As the age increases, the value decreases — B1
- (b) A line drawn up from 4 to the line of best fit and across — M1
- (b) \(\pounds 7000\) (accept \(\pounds 6800\) to \(\pounds 7200\)) — A1
- (c) 12 years is outside the range of the data — B1
- (c) The line would give a negative value — B1
-
3 Work out [3 marks]
A line of best fit for the hours of practice, \(x\), and the number of goals scored, \(y\), has the equation \(y = 0.5x + 4\). (a) Use the equation to estimate the number of goals for 10 hours of practice. [1 mark] (b) What does the number 0.5 represent? [1 mark] (c) Explain why the equation should not be used for 100 hours of practice. [1 mark]
Show answerHide answer
Model answer
(a) \(0.5 \times 10 + 4 = 9\). (b) For each extra hour of practice there are 0.5 more goals. (c) 100 hours is far outside the range of the data, and the pattern may not continue.
Mark scheme
- (a) 9 — B1
- (b) 0.5 more goals for each extra hour — B1
- (c) Outside the range of the data, so not reliable — B1
-
4 Explain [2 marks]
There is a positive correlation between the shoe size and the reading ability of primary school children. Does having bigger feet make a child a better reader? Give a reason for your answer. [2 marks]
Show answerHide answer
Model answer
No. Both shoe size and reading ability increase as a child gets older, so age explains both. Correlation does not mean that one thing causes the other.
Mark scheme
- No — B1
- A reason such as age affecting both — B1
-
5 Work out [3 marks]
A line of best fit on a scatter graph goes through \((0, 8)\) and \((10, 0)\). (a) Write down the type of correlation. [1 mark] (b) Use the line to estimate \(y\) when \(x = 5\). [2 marks]
Show answerHide answer
Model answer
(a) Negative correlation, because the line slopes downwards. (b) The line is halfway between \(x = 0\) and \(x = 10\) at \(x = 5\), so \(y\) is halfway between 8 and 0, which is 4.
Mark scheme
- (a) Negative — B1
- (b) Uses the gradient \(-0.8\) or the midpoint of the line — M1
- (b) 4 — A1
-
6 Work out [4 marks]
A line of best fit goes through the points \((4, 5)\) and \((12, 25)\). (a) Work out the gradient of the line. [2 marks] (b) Use the line to estimate \(y\) when \(x = 8\). [2 marks]
Show answerHide answer
Model answer
(a) \(\dfrac{25 - 5}{12 - 4} = \dfrac{20}{8} = 2.5\). (b) \(y = 2.5x - 5\), so when \(x = 8\), \(y = 2.5 \times 8 - 5 = 15\). Alternatively, \(x = 8\) is halfway between 4 and 12, so \(y\) is halfway between 5 and 25.
Mark scheme
- (a) \(\dfrac{20}{8}\) — M1
- (a) 2.5 — A1
- (b) \(y = 2.5x - 5\) or the midpoint — M1
- (b) 15 — A1
Quick check
-
1
What type of correlation has points sloping downwards from left to right?
Show answerHide answer
D: Negative
One variable falls as the other rises.
-
2
Which statement describes positive correlation?
Show answerHide answer
C: As one variable increases, the other increases
Positive correlation slopes upwards.
-
3
What is an outlier?
Show answerHide answer
B: A point that does not fit the pattern of the others
Outliers are far from the trend.
-
4
A line of best fit has equation \(y = 4x + 8\). Estimate \(y\) when \(x = 12\).
Show answerHide answer
A: \(56\)
\(4 \times 12 + 8 = 56\).
-
5
Data runs from 2 to 16 hours of revision. What do we call an estimate for 25 hours?
Show answerHide answer
D: Extrapolation
Outside the range of the data is extrapolation.
-
6
Which estimate is likely to be more reliable?
Show answerHide answer
C: One inside the range of the data
Interpolation is more reliable than extrapolation.
-
7
Ice cream sales and sunburn are positively correlated. What is the best explanation?
Show answerHide answer
B: Hot weather increases both
A third factor can cause both.
-
8
The line of best fit is \(y = 4x + 8\), where \(x\) is hours of revision and \(y\) is the test score. What does the gradient mean?
Show answerHide answer
A: Each extra hour of revision adds about 4 marks
The gradient is the change in score for each extra hour.
-
9
In \(y = 4x + 8\), what does 8 represent?
Show answerHide answer
D: The estimated score with no revision
It is the \(y\)-intercept, the value when \(x = 0\).
Cumulative Frequency and Box Plots
Just this lesson-
1 Complete [2 marks]
The table shows the frequencies of the times taken by 100 people. The classes \(0 < t \leq 5\), \(5 < t \leq 10\), \(10 < t \leq 15\), \(15 < t \leq 20\), \(20 < t \leq 25\) and \(25 < t \leq 30\) have the frequencies 8, 17, 25, 25, 17 and 8. Write down the cumulative frequencies. [2 marks]
Show answerHide answer
Model answer
The running totals are 8, 25, 50, 75, 92 and 100.
Mark scheme
- At least four cumulative frequencies correct — M1
- 8, 25, 50, 75, 92, 100 — A1
-
2 Work out [5 marks]
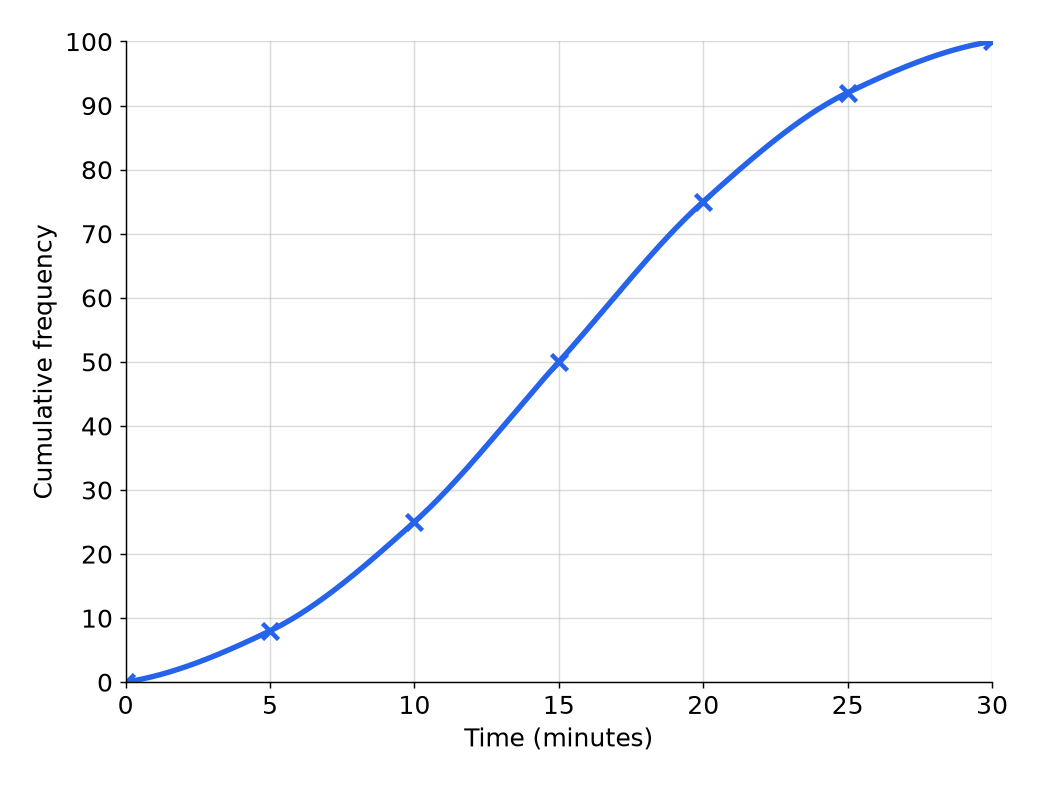
The cumulative frequency graph shows the times taken by 100 people to complete a puzzle. (a) Use the graph to find an estimate for the median time. [1 mark] (b) Use the graph to find an estimate for the interquartile range. [2 marks] (c) Use the graph to find an estimate for the number of people who took longer than 25 minutes. [2 marks]
Show answerHide answer
Model answer
(a) The median is at cumulative frequency 50, which is 15 minutes. (b) The lower quartile is at 25, which is 10 minutes, and the upper quartile is at 75, which is 20 minutes. The interquartile range is \(20 - 10 = 10\) minutes. (c) At 25 minutes the cumulative frequency is 92, so \(100 - 92 = 8\) people took longer.
Mark scheme
- (a) 15 (accept 14.5 to 15.5) — B1
- (b) Reads the quartiles at cumulative frequencies 25 and 75 — M1
- (b) 10 (accept 9 to 11) — A1
- (c) \(100 - 92\) — M1
- (c) 8 — A1
-
3 Compare [4 marks]
Box plot A shows the times for Group A: minimum 5, lower quartile 12, median 18, upper quartile 24 and maximum 40. Box plot B shows the times for Group B: minimum 8, lower quartile 14, median 18, upper quartile 20 and maximum 30. (a) Work out the interquartile range for each group. [2 marks] (b) Compare the times for the two groups. [2 marks]
Show answerHide answer
Model answer
(a) Group A: \(24 - 12 = 12\). Group B: \(20 - 14 = 6\). (b) The two groups have the same median, 18, so the typical time is the same. Group B has a smaller interquartile range, 6 compared with 12, so its times are more consistent.
Mark scheme
- (a) 12 — B1
- (a) 6 — B1
- (b) A comparison of the medians, in context — Q1
- (b) A comparison of the interquartile ranges, in context — Q1
-
4 Work out [3 marks]
The cumulative frequencies of the times, \(x\) minutes, of 100 people are 12 for \(x \leq 10\), 40 for \(x \leq 20\), 70 for \(x \leq 30\), 90 for \(x \leq 40\) and 100 for \(x \leq 50\). (a) How many people took a time in the class \(20 < x \leq 30\)? [1 mark] (b) How many people took more than 40 minutes? [1 mark] (c) Which class contains the median? [1 mark]
Show answerHide answer
Model answer
(a) \(70 - 40 = 30\). (b) \(100 - 90 = 10\). (c) The median is the 50th value, in the class \(20 < x \leq 30\), because the cumulative frequency goes from 40 to 70.
Mark scheme
- (a) 30 — B1
- (b) 10 — B1
- (c) \(20 < x \leq 30\) — B1
-
5 Explain [2 marks]
Explain why the interquartile range is often a better measure of spread than the range. [2 marks]
Show answerHide answer
Model answer
The range uses only the highest and lowest values, so one extreme value can change it a lot. The interquartile range covers the middle half of the data, so it is not affected by extreme values.
Mark scheme
- The range is affected by extreme values — B1
- The interquartile range is not affected, as it uses the middle half of the data — B1
-
6 Work out [4 marks]
A box plot shows a minimum of 12, a lower quartile of 20, a median of 28, an upper quartile of 34 and a maximum of 52. (a) Work out the range. [1 mark] (b) Work out the interquartile range. [1 mark] Another box plot has a median of 31 and an interquartile range of 8. (c) Make two comparisons of the distributions. [2 marks]
Show answerHide answer
Model answer
(a) \(52 - 12 = 40\). (b) \(34 - 20 = 14\). (c) The second distribution has a higher median, 31 compared with 28, so it is typically higher. It has a smaller interquartile range, 8 compared with 14, so it is more consistent.
Mark scheme
- (a) 40 — B1
- (b) 14 — B1
- (c) A comparison of the medians — Q1
- (c) A comparison of the interquartile ranges — Q1
Quick check
-
1
For \(n\) values, where is the median on a cumulative frequency graph?
Show answerHide answer
A: At cumulative frequency \(\dfrac{n}{2}\)
The median is the middle value.
-
2
For 100 values, at what cumulative frequency is the lower quartile?
Show answerHide answer
D: \(25\)
\(\dfrac{100}{4} = 25\).
-
3
The upper quartile is 70 and the lower quartile is 40. What is the interquartile range?
Show answerHide answer
C: \(30\)
\(70 - 40 = 30\).
-
4
Frequencies 10, 15, 25, 20, 30 are added up as you go. What are the cumulative frequencies?
Show answerHide answer
B: \(10, 25, 50, 70, 100\)
Each is the running total.
-
5
Where should the points on a cumulative frequency graph be plotted?
Show answerHide answer
A: At the upper boundary of each class
The cumulative frequency is up to the end of the class.
-
6
A cumulative frequency graph of 100 students has a cumulative frequency of 90 at a mark of 80. How many scored more than 80?
Show answerHide answer
D: \(10\)
\(100 - 90 = 10\).
-
7
Class A has an interquartile range of 30 and Class B has 15. Which is more consistent?
Show answerHide answer
C: Class B, because its IQR is smaller
A smaller interquartile range means more consistent.
-
8
For 80 values, at what cumulative frequency is the upper quartile?
Show answerHide answer
B: \(60\)
\(\dfrac{3}{4} \times 80 = 60\).
-
9
A box plot for Class B has a median of 55, and Class A has a median of 50. What can you say?
Show answerHide answer
A: Class B has the higher typical mark
A higher median means a higher typical value.
Histograms and Sampling
Just this lesson-
1 Work out [3 marks]
The table shows the lengths of some worms. For the class \(0 < l \leq 2\) the frequency is 6, for \(2 < l \leq 8\) it is 18, and for \(8 < l \leq 20\) it is 24. Work out the frequency density for each class. [3 marks]
Show answerHide answer
Model answer
The widths are 2, 6 and 12. The frequency densities are \(\dfrac{6}{2} = 3\), \(\dfrac{18}{6} = 3\) and \(\dfrac{24}{12} = 2\).
Mark scheme
- Class widths 2, 6 and 12 used — M1
- At least two frequency densities correct — A1
- 3, 3 and 2 — A1
-
2 Work out [4 marks]
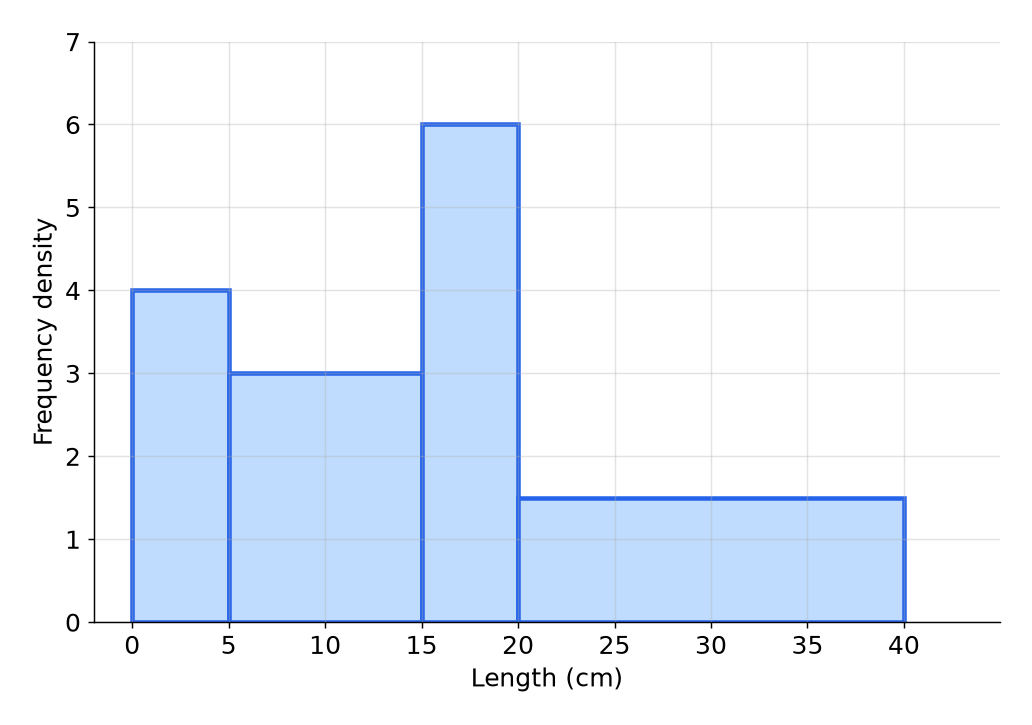
The histogram shows the lengths, in centimetres, of some worms. (a) Work out the number of worms with a length more than 15 cm and up to 20 cm. [2 marks] (b) Work out the number of worms with a length of more than 15 cm. [2 marks]
Show answerHide answer
Model answer
(a) The frequency is the area of the bar: \(6 \times 5 = 30\). (b) The bar from 20 to 40 has a frequency of \(1.5 \times 20 = 30\), so the total is \(30 + 30 = 60\).
Mark scheme
- (a) \(6 \times 5\) — M1
- (a) 30 — A1
- (b) \(1.5 \times 20 = 30\) — M1
- (b) 60 — A1
-
3 Work out [2 marks]
On a histogram the bar for the class \(5 < l \leq 15\) has a frequency density of 3. Work out an estimate for the number of values in the class \(5 < l \leq 8\). [2 marks]
Show answerHide answer
Model answer
The width of \(5 < l \leq 8\) is 3, so the estimate is \(3 \times 3 = 9\).
Mark scheme
- \(3 \times 3\) — M1
- 9 — A1
-
4 Work out [3 marks]
A company has 120 staff in Sales, 80 staff in Admin and 40 staff in IT. A stratified sample of 30 staff is taken. Work out the number of staff from each department in the sample. [3 marks]
Show answerHide answer
Model answer
There are 240 staff. Sales: \(\dfrac{120}{240} \times 30 = 15\). Admin: \(\dfrac{80}{240} \times 30 = 10\). IT: \(\dfrac{40}{240} \times 30 = 5\).
Mark scheme
- \(\dfrac{120}{240} \times 30\) or the total 240 seen — M1
- At least two numbers correct — A1
- 15, 10 and 5 — A1
-
5 Work out [3 marks]
In a lake, 40 fish are caught, marked and returned. Later, a sample of 90 fish is caught, and 12 of them are marked. (a) Work out an estimate for the number of fish in the lake. [2 marks] (b) State one assumption you have made. [1 mark]
Show answerHide answer
Model answer
(a) \(\dfrac{12}{90} = \dfrac{40}{N}\), so \(N = \dfrac{40 \times 90}{12} = 300\). (b) The marked fish have mixed evenly with the others, and none have joined or left the lake.
Mark scheme
- (a) \(\dfrac{40 \times 90}{12}\) — M1
- (a) 300 — A1
- (b) The marked fish have mixed evenly, or the population has not changed — B1
-
6 Explain [2 marks]
Beth wants the views of residents about a new park. She asks 30 people as they leave a sports centre. (a) Give one reason why her sample may be biased. [1 mark] (b) Describe how she could improve her sampling. [1 mark]
Show answerHide answer
Model answer
(a) People at a sports centre are more likely to want a park, so they do not represent all the residents. (b) Choose people from all the residents at random, for example from the electoral roll using random numbers.
Mark scheme
- (a) The sample is not representative of all the residents — B1
- (b) A random sample from all the residents — B1
Quick check
-
1
What is the formula for frequency density?
Show answerHide answer
B: Frequency divided by class width
Frequency density \(= \dfrac{\text{frequency}}{\text{class width}}\).
-
2
What does the area of a bar in a histogram show?
Show answerHide answer
A: The frequency
Area \(=\) frequency density \(\times\) class width \(=\) frequency.
-
3
A histogram bar has class width 20 and frequency density 3. What is the frequency?
Show answerHide answer
D: \(60\)
\(3 \times 20 = 60\).
-
4
A class of width 10 has frequency 30. What is its frequency density?
Show answerHide answer
C: \(3\)
\(\dfrac{30}{10} = 3\).
-
5
A survey about exercise only asks people leaving a gym. What is wrong with the sample?
Show answerHide answer
B: It is biased towards people who exercise
People at a gym are not typical of the whole population.
-
6
A school has 600 pupils, 240 in Year 10. A stratified sample of 50 is taken. How many Year 10 pupils are in the sample?
Show answerHide answer
A: \(20\)
\(\dfrac{240}{600} \times 50 = 20\).
-
7
50 fish are marked and released. A second sample of 40 fish contains 8 marked fish. What is the estimate of the population?
Show answerHide answer
D: \(250\)
\(\dfrac{50 \times 40}{8} = 250\).
-
8
A histogram bar from 30 to 40 has frequency 40. Estimate the number of values from 30 to 35.
Show answerHide answer
C: \(20\)
35 is halfway through the class, so about half the frequency: 20.
-
9
Why does a larger sample usually give a better estimate?
Show answerHide answer
B: It is more likely to represent the whole population
Bigger samples are less affected by chance.